The Relation Between Dialysis-requiring Acute Kidney Injury And Recovery From End-stage Renal Disease: A National Study
Feb 24, 2022
Zijin Chen1,2, Benjamin J. Lee2,3,4 et al
Abstract
Background: Approximately 4–6% of incident end-stage renal disease (ESRD) patients in the U.S. recover enough kidney function to discontinue dialysis but there is considerable geographic variation. We undertook this study to investigate whether state-level variations in renal recovery among incident ESRD patients correlated with state-level variations in the incidence of acute kidney injury requiring dialysis (AKI-D).
Methods: We conducted a national cross-sectional ecological study at the state level using data from State Inpatient Databases and U.S. Renal Data System. All hospital admissions and all ESRD patients in 18 US states (AZ, AR, CA, FL, IA, KY, MA, MD, MI, NJ, NM, NY, NV, OR, RI, SC, VT, and WA) were included. Correlation between AKI-D incidence and rate of renal recovery across states was determined using Pearson’s r (overall and in subgroups). We also calculated partial correlations adjusted for sex and age.
Results: AKI-D incidence ranged from 99.0 per million population (pmp) in Vermont to 490.4 pmp in Nevada. The rate of renal recovery among incident ESRD patients ranged from 8.8 pmp in Massachusetts to 29.3 pmp in Florida. A positive correlation between AKI-D incidence and rate of renal recovery among incident ESRD patients at the state level was found overall (unadjusted r =0.67; p = 0.002) and in age, sex, and race subgroups. The overall correlation persisted after adjusting for age (adjusted r =0.62; p < 0.001) and sex (adjusted r =0.65; p <0.001).
Conclusion: Our findings suggest that AKI-D incidence is an important driver of renal recovery rates among incident ESRD patients.
Keywords: AKI-D, ESRD, Renal recovery
Contact: joanna.jia@wecistanche.com / WhatsApp: 008618081934791

Cistanche tubulosa prevents kidney disease, click here to get the sample
Background
Recent studies suggest that the rate of renal recovery among patients on maintenance dialysis has increased over the last two decades such that 4–6% of contemporary patients registered with incident end-stage renal disease (ESRD) in the United States become dialysis in- dependent within 1 year [1, 2]. This somewhat surprising observation may reflect an increasing number of patients entering the ESRD program after acute kidney injury (AKI) requiring dialysis (AKI-D) who subsequently recovered kidney function over a period of months.
Prior research also reported geographic variation in renal recovery rates among incident ESRD patients in the United States [2] but the reasons behind this observation are not well understood. Therefore, we undertook this study to investigate whether state-level variations in AKI-D correlated with state-level variations in renal recovery among incident ESRD patients.
Methods
Study design
We conducted a national, cross-sectional, ecologic study of AKI-D and renal recovery among incident ESRD patients in the United States.
Determination of the number of AKI-D hospitalizations at the state level
We used State Inpatient Databases (SID) to determine the number of AKI-D hospitalizations [3]. SID is part of the family of databases and software tools developed for the Healthcare Cost and Utilization Project (HCUP), developed through a U.S. Federal-State-Industry partnership. The SID contains the universe of the inpatient discharge abstracts in participating States, translated into a uniform format to facilitate multi-State comparisons and analyses. The SID contains a core set of clinical and nonclinical information on all patients, regardless of insurance status [3–5].
Although there were 30 SID databases available for 2011, we only had financial resources to purchase 25 of them. We selected a convenience sample of 25 of the larger states by geographic region (which captured 90% of discharges): Arizona (AZ), Arkansas (AR), California (CA), Colorado (CO), Florida (FL), Iowa (IA), Kentucky (KY), Massachusetts (MA), Maryland (MD), Maine (ME), Michigan (MI), Mississippi (MS), North Carolina (NC), Nebraska (NE), New Jersey (NJ), New Mexico (NM), New York (NY), Nevada (NV), Oregon (OR), Rhode Island (RI), South Carolina (SC), Utah (UT), Vermont (VT), Washington (WA), and West Virginia (WV)(Additional file 1: Figure S1). The different state databases varied in capturing whether a diagnosis was present on admission or not and in indicating whether an admission represented a re-admission to the hospital for the same patient in a given calendar year.
We defined AKI-D as requiring both a diagnostic code for acute renal failure (International Classification of Diseases, Ninth Revision, Clinical Modification [ICD-9] codes 584.5, 584.6, 584.7, 584.8, or 584.9) and a procedure code for dialysis (39.95, V45.11, V45.12, V56.0, or V56.2), along with the absence of procedure codes for arteriovenous fistula creation or revision (39.27, 39.42, 39.43, or 39.93) [6–8]. This algorithm has been shown to be sensitive and specific, producing high positive and negative predictive values (all ≥90%) [6–8].
To address potential ascertainment bias arising from the fact that states reported different numbers of diagnostic codes (range 9–60) and different numbers of procedure codes (range 6–30) for each individual in these databases, we first analyzed the number of actual diagnostic codes and procedure codes for each hospitalization. Of the 25 SID databases, 19 (AZ, AR, CA, CO, FL, IA, KY, MD, MI, NV, NJ, NM, NY, NC, OR, RI, VT, WA, and WV) reported > 15 diagnostic codes. In none of these 19 states did more than a quarter of the hospitalizations have > 15 diagnostic codes (range 4.1–24.5%). Of the 25 SID databases, 19 states (AZ, AR, CA, CO, FL, IA, KY, MD, MA, MI, NV, NJ, NY, NC, OR, RI, SC, VT, and WA) reported > 6 procedure codes. In none of these 19 states did more than a tenth of the hospitalizations have > 6 procedure codes (range 1.6–6.1%). Thus in our primary analysis, we excluded the 2 states with fewer than 15 diagnostic codes (ME, NE)
(Additional file 1: Figure S1). All states had at least 6 procedure codes. For the remaining states, we only analyzed the first 15 diagnostic codes and first 6 procedure codes listed for each hospitalization (i.e. for states whose database contained additional informa- tion, we ignored the diagnostic codes in position 16 and above and we ignored procedure codes in pos- ition 7 and above).
We did not count as AKI-D hospitalizations those hos- pitalizations with a diagnostic code for ESRD present on admission (585.6). Thus, in our primary analysis, we additionally excluded 5 states (CO, MS, NC, UT, WV) whose SID did not specify whether a diagnosis of ESRD was present on admission or not) (Additional file 1: Figure S1). (We did include AKI-D hospitalizations with a diagnosis of ESRD only on discharge but not on admission.)
Therefore, our primary analysis was based on 18 states (AZ, AR, CA, FL, IA, KY, MA, MD, MI, NJ, NM, NY, NV, OR, RI, SC, VT, WA) (Additional file 1: Figure S1). In 2011, these 18 states accounted for 50% of the coun- try’s incident ESRD cases [9].
In sensitivity analyses, we used data from all 25 states we had SID data on but to make ascertainment more uniform, we only analyzed up to 9 diagnostic codes and up to 6 procedure codes for each state (all states re- ported at least these numbers of codes). In this sensitiv- ity analysis, we used the same AKI-D definition as above, but we excluded all hospitalizations containing a diagnostic code for ESRD (585.6) regardless of whether it was present on admission or not (since for CO, MS, NC, UT, and WV, we could not tell if a given diagnosis was present on admission or not).
Determination of incidence of AKI-D per state
To calculate AKI-D incidence, we used as denominator state populations according to US Census Bureau [10, 11].
We considered AKI-D hospitalization per year as be- ing equal to the number of patients who had AKI-D per year [12]. We based this on the fact that in the 8 states in which readmission can be identified (using the ‘Visi- tLink’ variable in the AR, CA, FL, IA, MA, NM, NY, VT, and WA databases), only 0.0–8.7% of patients had more than one AKI-D hospitalization.

Determination of the number of renal recovery cases among incident ESRD patients
The US Renal Data System (USRDS) is a national regis- try that includes virtually all patients with treated ESRD in the United States [13]. We defined renal recovery among incident ESRD patients as a reported treatment modality of “recovered function” ≥ 90 days in the absence of renal transplant or death, within 1 year of dialysis initiation [1].
In additional sensitivity analyses, we used a broader definition of recovery, grouping the “recovered function, ” “discontinued dialysis,” and “lost to follow-up” mo- dalities together as time in a recovered state. Patients who remained alive in this recovered state for ≥90 days without a renal transplant were counted as re- covered [1]. Finally, we also examined only recovery within 6 months and not 12 months after initiation of dialysis.
Determination of the number of nephrologists per state
To explore whether the absence of renal recovery among incident ESRD patients might be related to the number of nephrologists (i.e. supplier-induced demand) and thus might be a state-level confounder, we also examined if the number of nephrologists in each state in 2011 was associ- ated with renal recovery. We determined the number of nephrologists using the American Medical Association (AMA) Physician Professional Data (PPD) Statistical Re- search file [14, 15] which includes current and historical data for more than 1.4 million physicians, residents, and medical students in the United States and their mailing addresses [14, 15]. Physicians are known to be retired, de- ceased, or in a training program through the end of 2011 were excluded.
Statistical approach
The AKI-D incidence and rate of renal recovery among incident ESRD patients were both expressed as per mil- lion population (pmp) per year for each state. We used Pearson correlations to analyze the association between AKI-D incidence and rate of renal recovery across states. We repeated our analyses in subgroups defined by sex, age (45–64, 65–74, ≥75 years). We did not show results for age 0–44 years old due to a small number of outcomes (for example, 8 of the 18 states had fewer than 10 observed cases of renal recovery among incident ESRD patients of this age range).
We also did not show results stratified by race/ethni- city as 10 of the 18 states had fewer than 10 observed cases of renal recovery among incident, non-Hispanic black ESRD patients. We also used partial correlation to analyze AKI-D incidence and the rate of renal recovery across states adjusted by sex and age groups. (We did not adjust for the race as there was no correlation between race and AKI-D incidence and no correlation between race and rate of renal recovery.)
Data were analyzed using SPSS version 23.0 (IBM SPSS, Chicago, IL). Results were independently confirmed using SAS version 9.4 (SAS Institute Inc., Cary, NC) or STATA version 14.1 (College Station, TX) by separate analysts.

Results
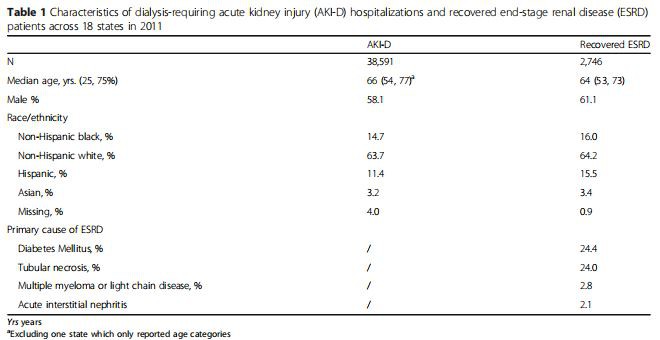
In our primary analysis using 18 states in 2011, we iden- tified 38,591 AKI-D hospitalizations and 2,746 incident ESRD patients with renal recovery (Table 1).
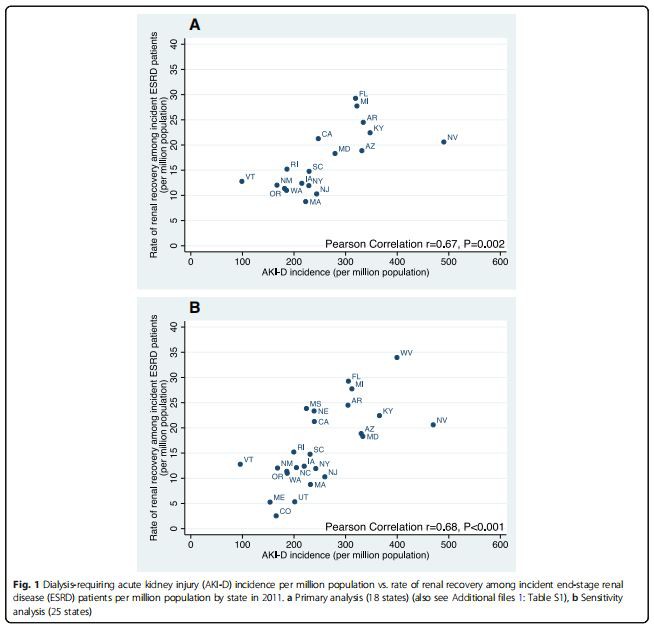
There was clear geographic variation among the states in both AKI-D incidence and rate of renal recovery among incident ESRD patients (Fig. 1; Additional file 1: Table S1). AKI-D incidence ranged from 99.0 pmp in Vermont to 490.4 pmp in Nevada. While the rate of renal recovery among incident ESRD patients ranged from 8.8 pmp in Massachusetts to 29.3 pmp in Florida. Figure 1a shows the positive correlation between AKI-D incidence and rate of renal recovery among incident ESRD patients at the level of the state (unadjusted r =0.67; p = 0.002).
In our sensitivity analyses using data from all 25 states (44,152 AKI-D hospitalizations), we saw a similar posi- tive correlation between AKI-D incidence and rate of renal recovery among incident ESRD patients at the state level (unadjusted r = 0.68; p < 0.001) (Fig. 1b). Simi- lar results were seen when we used a more liberal defin- ition of recovery (this resulted in a 1.13-fold increase in the number of patients classified as recovered in the 18 states) (unadjusted r = 0.73, p = 0.001) or when we only considered cases which recovered within 6 months (unadjusted r = 0.61, p = 0.006).
In subgroup analyses, there was evidence of a correlation between AKI-D incidence and rate of renal recovery among incident ESRD patients in all subgroups (Add- itional file 1: Figure S2, Additional file 1: Figure S3).
In partial correlation analyses, we also found a signifi- cant and positive correlation between AKI-D incidence and rate of renal recovery among incident ESRD patients after adjusting for age (partial correlation r =0.62; p < 0.001) and sex (partial correlation r =0.65;p <0.001).
There was no statistically significant correlation be- tween the number of board-certified nephrologists pumps and the rate of renal recovery among incident ESRD patients (r = − 0.31; p =0.22).
Discussion
In this national cross-sectional ecological study conducted at the state level, we found a strong correlation between AKI-D incidence and rate of renal recovery among incident ESRD patients in 2011. These data support the hypothesis that AKI-D may be a key driver of renal recovery trends among incident patients deemed to have ESRD.
There are several reasons why AKI-D could be misdiagnosed as ESRD. Chronic kidney disease (CKD) is a strong risk factor for AKI-D and severity of CKD is a strong predictor of non-recovery after AKI-D [16, 17], making it challenging for clinicians to predict whether AKI-D patients will recover sufficiently to be able to discontinue dialysis or not.
Our findings serve to remind clinicians that some incident dialysis patients who are labeled as “ESRD” could potentially recover. Thus, it is important for providers to understand the details surrounding dialysis initiation, particularly when patients transfer care to a new out-patient nephrologist. Extra efforts need to be made to obtain medical records surrounding dialysis initiation, including knowledge of the pre-AKI level of estimated glom- erular filtration rate (eGFR) and amount of proteinuria which are strongly correlated with chances of kidney recovery to come off dialysis [17]. Knowing that certain patients may recover may lead to different clinical deci- sion-making (e.g., tolerating more liberal blood pressure targets, avoiding nephrotoxins more aggressively, imple- menting repeated monitoring of residual renal function or urine output volume, and making more frequent nephrologist rounds). Future studies that examine optimal monitoring and treatment of AKI-D patients will be informative.
Our findings have policy-level implications as well. National health improvement targets are set using USRDS data. For example, one of the Healthy People 2020 goals is to reduce ESRD incidence by 10% [18].
Given that thousands of people with incident ESRD each year may regain enough renal function to discontinue dialysis, ESRD incidence estimates corrected for recovery might be considered as a superior metric to track disease burden. In addition, given that many AKI-D patients recover only after several months [16, 19], it may be un- reasonable to expect clinicians to classify definitively whether a patient has ESRD or not as soon as he or she transitions to outpatient dialysis (via the CMS 2728 form [20] used to register patients into the USRDS ESRD database). Perhaps a “follow-up CMS 2728” form to confirm ESRD status would be beneficial to confirm ESRD for insurance and other considerations.
Further research into regional variation in rates of acute and chronic kidney disease may shed light on pathophysiology and help identify ways to improve care. For example, studies of the impact of climate differences on AKI incidence may be fruitful [21, 22]. Other possibilities include different causes of AKI by region or the contribution of patient case-mix to recovery after AKI.
Strengths of our study include our large sample of hospitalization data from 19 states (and sensitivity ana- lysis including 25 states) and the nationally comprehen- sive USRDS data. We strove for accurate capture of AKI-D cases by excluding patients with an ESRD diag- nosis on admission. We also checked readmission codes of hospitalizations to ensure that it was appropriate to consider AKI-D hospitalization incidence as representing AKI-D incidence. It is also reassuring that our primary, subgroup, and sensitivity analyses yielded similar results.
Several limitations of our study should be noted. We did not have access to actual clinical data, such as serum creatinine, but relied on the best-validated set of ICD-9 diagnostic and procedure codes to define AKI-D [7, 8]. Some bias and imprecision may have been introduced into our analyses due to different SID datasets having a different number of diagnostic and procedure codes. We only counted renal recovery cases among those reported to USRDS as having ESRD. Patients with AKI-D who transitioned to out-patient dialysis units but who were not reported to USRDS were not included. Thus, the actual number of affected patients may be larger. Our analyses were limited to one calendar year (2011). We did not have SID data from all 50 states and we were unable to track readmission across multiple calendar years.
We acknowledge that this is an ecological analysis and hence subject to ecological fallacy. Our subgroup analyses by age and gender provide some reassuring data (i.e. we did not observe that all the AKI-D cases were in men and all the recovered ESRD cases were in women in a given state). We do not have individual patient-level data (including accurate information regarding under- lying etiology of AKI-D) and were limited in what we could adjust for on a state level. It is possible that our results are confounded by the state-level differences in prac- tice or policy which would increase both AKI-D inci- dence and likelihood of recovery from ESRD within a state. However, we are not aware of any information suggesting there are important geographic variations in pertinent practice or policy by the state. It is possible that practices could be inconsistent across geographic regions and could possibly have influenced our results, for ex- ample, earlier dialysis in the course of AKI in one state more than another would inflate a number of AKI-D cases as well as increase the number of ESRD patients who eventually recover. The lack of correlation between the number of nephrologists and AKI-D incidence (arguing against supplier-induced demand) provides some reassurance. Furthermore, we believe our conclusion from this ecological study that AKI-D may be a key driver of renal recovery trends among incident patients deemed to have ESRD is strengthened by biological plausibility. Patients arrive at ESRD through only one of two possible disease pathways—slowly progressive CKD or AKI-D (not infrequently superimposed on CKD). The latter may recover but the former will not. Thus it is not surprising that states which have higher rates of AKI-D pmp also have higher rates of recovery from AKI-D pmp.
Conclusions
Renal recovery among incident ESRD patients is not uncommon but few research publications have focused on this phenomenon and its implications for reporting and for setting public policy. To our knowledge, our study is the first to describe a geographic correlation between AKI-D incidence and renal recovery rates among pa- tients starting maintenance dialysis at a state level. Our findings suggest that AKI-D incidence is an important driver of renal recovery rates among incident ESRD patients and raise important considerations regarding optimal care for AKI-D patients who continue to require dialysis after hospital discharge.
References
1. Lee BJ, Johansen KL, McCulloch CE, Hsu CY. The potential impact of Medicare payment policy on misclassification of Dialysis-requiring acute kidney injury as ESRD: a National Temporal Trend Analysis. Am J Kidney Dis. 2018;72(2):311–3.
2. Mohan S, Huff E, Wish J, et al. Recovery of renal function among ESRD patients in the US Medicare program. PLoS One. 2013;8(12):e83447.
3. HCUP State Inpatient Databases (SID). Healthcare Cost and Utilization Project (HCUP). 2005–2009. Agency for Healthcare Research and Quality R,
MD. www.hcup-us.ahrq.gov/sidoverview.jsp. Accessed 14 Sept 2018.
4. Birkmeyer JD, Siewers AE, Finlayson EV, et al. Hospital volume and surgical mortality in the United States. N Engl J Med. 2002;346(15):1128–37.
5. Jain NB, Ayers GD, Peterson EN, et al. Traumatic spinal cord injury in the United States, 1993-2012. JAMA. 2015;313(22):2236–43.
6. Hsu RK, McCulloch CE, Ku E, Dudley RA, Hsu CY. Regional variation in the incidence of dialysis-requiring AKI in the United States. Clin J Am Soc Nephrol. 2013;8(9):1476–81.
7. Waikar SS, Wald R, Chertow GM, et al. Validity of international classification of diseases, ninth revision, clinical modification codes for acute renal failure. J Am Soc Nephrol. 2006;17(6):1688–94.
8. Hsu RK, McCulloch CE, Dudley RA, Lo LJ, Hsu CY. Temporal changes in the incidence of dialysis-requiring AKI. J Am Soc Nephrol. 2013;24(1):37–42.
9. 2017 USRDS Annual Data Report Reference Table. https://www.usrds.org/2 017/ref/ESRD_Ref_A_Incidence_2017.xlsx. Accessed September 14, 2018.
10. Annual Estimates of the Resident Population for the United States, Regions, States, and Puerto Rico: April 1, 2010, to July 1, 2017 (NST-EST2017-01). Accessed 14 Sept 2018.
11. Annual Estimates of the Resident Population for Selected Age Groups by Sex for the United States, States, Counties and Puerto Rico Commonwealth and Municipios: April 1, 2010, to July 1, 2016. Accessed 14 Sept2018.
12. Khera R, Angral S, Couch T, et al. Adherence to methodological standards in research using the National Inpatient Sample. JAMA. 2017;318(20):2011–8.
13. Saran R RB, Shahinian V, et al. US renal data system 2017 annual data report: epidemiology of kidney disease in the United States. Am J Kidney Dis. 2018; 71(3S1): A7.
14. The American Medical Association Physician Masterfile. https://www.ama -assn.org/life-career/ama-Physician-Masterfile. Accessed 14 Sept 2018.
15. The AMA Physician Mailing List. http://www.mmslists.com/physician-lists -data. Accessed 14 Sept 2018.
16. Hsu CY, Chertow GM, McCulloch CE, Fan D, Ordonez JD, Go AS. Nonrecovery of kidney function and death after acute on chronic renal failure. Clin J Am Soc Nephrol. 2009;4(5):891–8.
17. Lee BJ, Go AS, Parikh R, et al. Pre-admission proteinuria impacts the risk of non- recovery after dialysis-requiring acute kidney injury. Kidney Int. 2018;93(4):968–76.
18. Lopes AAS, Port FK. The low birth weight hypothesis is a plausible explanation for the black/white differences in hypertension, non-insulin-dependent diabetes, and end-stage renal disease. Am J Kidney Dis. 1995;25:350–6.
19. Lo LJ, Go AS, Chertow GM, et al. Dialysis-requiring acute renal failure increases the risk of progressive chronic kidney disease. Kidney Int. 2009;76(8):893–9.
20. ESRD Medical Evidence Report Medicare Entitlement and/or Patient registration. https://www.cms.gov/Medicare/CMS-Forms/CMS-Forms/CMS -Forms-Items/CMS008867.html. Accessed 14 Sept 2018.