A Rapid TLC-Image Digitalization Method For Simultaneous Quality Analysis Of Four Major Phenylethanoid Glycosides In Cistanche
May 19, 2026
Abstract
This study established a thin-layer chromatography (TLC) method based on image digitalization for the rapid, simple, and low-cost detection of four major phenylethanoid glycosides (PhGs) in Cistanche. The four PhGs were extracted using 50% methanol and separated on a polyamide plate with a mobile phase consisting of methanol‑chloroform‑glacial acetic acid‑water (3.5:1.5:1:7, V/V/V/V). Spot images were captured under 365 nm UV light and digitally analyzed using ImageJ software, which generated integrated gray values for rapid quantitative analysis. The method demonstrated excellent linearity for echinacoside, tubuloside A, acteoside, and isoacteoside, with correlation coefficients (r) of 0.9974, 0.9931, 0.9923, and 0.9890, respectively. Recoveries ranged from 87.1% to 96.5%, 88.4% to 109.7%, 94.1% to 105.1%, and 97.0% to 115.1%, respectively. The quantitative results obtained by this method were consistent with those from high‑performance liquid chromatography (HPLC). This study provides a rapid and accurate method for the quantitative analysis of four key PhGs in Cistanche.
Keywords: Cistanche tubulosa; phenylethanoid glycosides; thin‑layer chromatography; ImageJ; rapid cistanche quality analysis
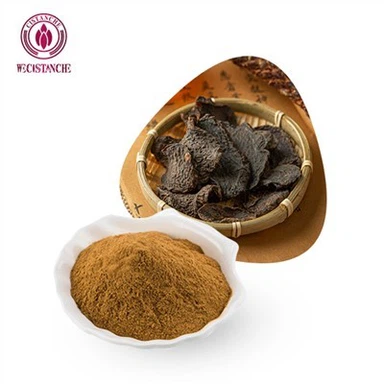
Cistanche Extract with high content of echinacoside

1. Introduction
Cistanche is a perennial parasitic herb of the Orobanchaceae family, primarily found in the Xinjiang, Inner Mongolia, and Ningxia regions of China. As a plant resource with both medicinal and edible value, its dried succulent stems have demonstrated significant economic potential across multiple industries. Among the various Cistanche species, Cistanche deserticola and Cistanche tubulosa are officially listed in the Chinese Pharmacopoeia, while both species, along with Cistanche salsa, are recognized as the crude drug "Nikujuyou" in the Japanese Pharmacopoeia. Moreover, Cistanche plays a crucial role in improving the ecological environment of arid regions, as its co‑planting with host plants delivers substantial ecological and economic benefits to desert and semi‑desert areas.
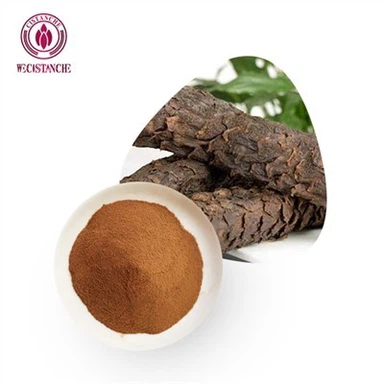
Cistanche Extract with a specific content of flavonoid

In traditional Chinese medicine (TCM), Cistanche is highly regarded as an excellent tonic. In 2020, it was approved as a novel food ingredient in China, significantly expanding its market and product development. Cistanche is not only used to treat kidney‑yang deficiency, blood and essence depletion, impotence and infertility, and constipation, but also shows promising potential in treating liver fibrosis. Chemical composition studies have identified phenylethanoid glycosides (PhGs) as one of the major active components in Cistanche. These compounds-including echinacoside, acteoside, tubuloside A, and isoacteoside-exhibit a wide range of pharmacological effects, including anti‑aging, antioxidant, anti‑fatigue, and laxative properties. Echinacoside and acteoside are the official marker components for the quality control of Cistanche in pharmacopoeial standards. Tubuloside A demonstrates significant anti‑inflammatory and antioxidant activities, while isoacteoside has been associated with cognitive improvement and cytoprotective effects.
Traditional analytical methods for PhGs in Cistanche include high‑performance liquid chromatography (HPLC), ultra‑high‑performance liquid chromatography (UPLC), and liquid chromatography‑mass spectrometry (LC‑MS). However, these methods rely on expensive instrumentation, require time‑consuming sample preparation, and demand highly skilled operators. Although near‑infrared (NIR) spectroscopy offers a rapid and nondestructive alternative, it still depends on large NIR instruments and is not readily portable. Consequently, there is a pressing need for a low‑cost, easy‑to‑operate, and portable method suitable for on‑site qualitative and quantitative analysis, particularly for primary testing applications.
In recent years, advances in computer vision technology have enabled image recognition and processing to enhance traditional analytical techniques, making TLC an effective quantitative method. This approach correlates the gray value of sample spots with their concentration. ImageJ, an open‑source image processing software, stands out for its user‑friendliness and versatility. For instance, Bai et al. developed a TLC‑ImageJ method for quantifying γ‑aminobutyric acid (GABA) in rice, validating the feasibility of this approach for image‑based quantitative analysis.
In this study, we captured TLC spot images of four major PhGs in Cistanche, established a linear relationship between PhG content and integrated gray values, and achieved quantitative analysis of all four compounds. This approach offers a new solution for on‑site rapid, low‑cost detection and holds broad application potential.
About Chengdu Wecistanche Bio-Tech Co., Ltd. - the world's largest Cistanche processing company, with a 200,000‑acre Cistanche cultivation base, a GMP factory capable of processing 20,000 tons of fresh Cistanche annually, and over 14 patents related to Cistanche extraction technologies including advanced membrane separation technology. We specialize in Cistanche extracts originating from Hotan, Xinjiang, and our products meet international quality standards of the United States and the European Union. Importantly, we focus on Cistanche tubulosa extract, which naturally contains a higher content of phenylethanoid glycosides-including echinacoside, acteoside, tubuloside A, and isoacteoside-making it the superior choice for nutraceutical and functional food applications.
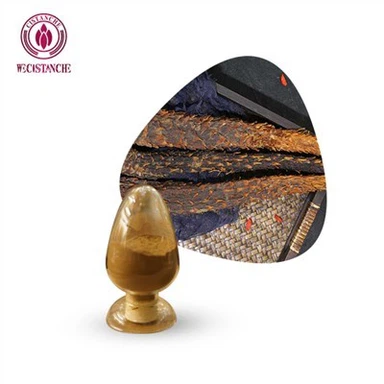
Cistanche Extract with a specific content of acteoside

2. Materials and Methods
2.1 Instruments and Reagents
Equipment: 1000T multifunctional grinder (MinYe Industry and Trade Co., Yongkang, China); AB135‑S analytical balance (Mettler‑Toledo, Switzerland); GAMAG LINOMAT 5 semi‑automatic spotter (CAMAG, Switzerland); UV lamp (CAMAG, Switzerland); 1200 series HPLC system (Agilent, USA); Advanced‑III‑18W ultrapure water system (Tang's Kangning Technology, Chengdu, China); polyamide TLC plates (10 cm × 10 cm, 10 cm × 20 cm; Sijia Biochemical Plastics, Taizhou, China); twin‑trough developing chamber (200 mm × 200 mm).
Reagents: Methanol (analytical grade, Beilian Fine Chemicals, Tianjin, China); methanol and acetonitrile (chromatography grade, Sigma‑Aldrich, Shanghai, China); glacial acetic acid (analytical grade, Zhiyuan Chemical Reagents, Tianjin, China); formic acid and chloroform (analytical grade, Damao Chemical Reagents, Tianjin, China); ultrapure water. Echinacoside, tubuloside A, acteoside, and isoacteoside reference standards (purity ≥98%, Yinglai Technology, Beijing, China).
Samples: Fresh Cistanche samples were sourced from Xinjiang, China, and processed by Chengdu Wecistanche Bio-Tech Co., Ltd. A total of 51 batches of Cistanche tubulosa and 8 batches of Cistanche deserticola were collected, sliced, dried, ground into powder, and sealed for storage.
Image acquisition: iPhone 15 Pro (12MP resolution, F2.2 aperture, 2× optical zoom). Image digitalization software: F Color Picker (Deweibo) and ImageJ (version 1.54p, National Institutes of Health, USA).
2.2 Experimental Methods
2.2.1 Preparation of Reference Standard Solutions
Echinacoside, tubuloside A, acteoside, and isoacteoside reference standards were accurately weighed, dissolved in 50% (V/V) methanol, and diluted to volume in 10 mL flasks to obtain stock solutions at concentrations of 1.003, 1.007, 1.004, and 1.005 mg/mL, respectively.
Aliquots of each stock solution (echinacoside 2 mL, tubuloside A 0.5 mL, acteoside 1 mL, isoacteoside 0.5 mL) were transferred to a 10 mL flask, diluted to volume with 50% methanol, and filtered through a 0.22 μm membrane to obtain a mixed reference standard solution containing 210.02, 52.40, 101.12, and 51.14 μg/mL, respectively.
2.2.2 Preparation of Test Sample Solutions
Cistanche samples were sliced, dried, and ground to pass through a 0.425 mm sieve. C. tubulosa powder (0.5 g) or C. deserticola powder (1.0 g) was accurately weighed, mixed with 30 mL of 50% methanol, sonicated for 40 min, and reweighed to compensate for any weight loss. The solution was filtered through a 0.22 μm membrane to obtain the test sample solution.
2.2.3 TLC Developing Solvent Selection
Based on solvent polarity, elution strength, and preliminary experimental results, three developing solvent systems were evaluated:
System 1: Methanol‑glacial acetic acid‑water (2:1:7, V/V)
System 2: Methanol‑chloroform‑glacial acetic acid‑water (2:1.5:1:7, V/V)
System 3: Methanol‑chloroform‑glacial acetic acid‑water (3.5:1.5:1:7, V/V)
Aliquots (5 μL each) of the mixed reference standard solution and test sample solution were applied as bands onto polyamide TLC plates. After development, the plates were dried, and the retardation factors (Rf values) were calculated.
2.2.4 Image Acquisition and Processing
TLC plates were fixed and examined under 365 nm UV light. An iPhone 15 Pro mounted on a stand was used to capture images from a uniform angle and height. F Color Picker and ImageJ software were employed for digital quantitative analysis, converting TLC images into RGB values, peak areas, and integrated gray values. Background subtraction and image inversion were performed using ImageJ. The images were then converted to 8‑bit grayscale, re‑inverted, and contrast‑adjusted for visualization. Target bands were selected for integration analysis using gray values for quantification.
Cistanche Extract Specs List

3. Results and Discussion
3.1 Selection of Developing Solvent
The Rf values of the four PhGs were systematically compared across the three developing solvents tested. Solvent Systems 1 and 2 showed insufficient polarity, resulting in spots that did not migrate beyond half the plate height and poor separation. Solvent System 3 (methanol‑chloroform‑glacial acetic acid‑water, 3.5:1.5:1:7, V/V/V/V) yielded sharp and clearly separated spots with Rf values of 0.67 (echinacoside), 0.38 (tubuloside A), 0.68 (acteoside), and 0.24 (isoacteoside). Therefore, System 3 was selected for all subsequent TLC analyses.
3.2 Method Validation
3.2.1 Calibration Curve and Image Processing Method Selection
Mixed reference standard solutions at five concentration levels were prepared, and 5 μL of each was analyzed by TLC. Images were processed using ImageJ, and calibration curves were constructed by plotting concentration (x, μg/mL) against integrated gray value (y). The linear ranges were 21–210 μg/mL for echinacoside, 5.2–52 μg/mL for tubuloside A, 10.1–101 μg/mL for acteoside, and 5.2–52 μg/mL for isoacteoside.
Three image digitalization methods were compared:
Integrated gray value – using ImageJ to measure mean spot gray value × pixel area (Ctrl + M).
Peak area – generating contour plots and measuring spot peak area using the wand tool.
RGB values – using F Color Picker to obtain R, G, B channel intensities at the spot center, with optimized combinations (2G+B for echinacoside, R for tubuloside A, 2R+G for acteoside and isoacteoside).
Among these methods, the integrated gray value approach yielded the highest correlation coefficients (r ≥ 0.9890), indicating superior accuracy for TLC image digitalization.
3.2.2 Limits of Detection and Quantitation
LOD and LOQ were calculated as LOD = 3.3σ/S and LOQ = 10σ/S (where σ = standard deviation of the intercept and S = slope of the calibration curve). The LOD values were 0.041 μg/band (echinacoside), 0.005 μg/band (tubuloside A), 0.008 μg/band (acteoside), and 0.011 μg/band (isoacteoside). The corresponding LOQ values were 0.138, 0.017, 0.026, and 0.037 μg/band, respectively.
3.2.3 Precision, Stability, and Repeatability
The relative standard deviation (RSD) of integrated gray values for the four PhGs ranged from 0.56% to 2.4% for precision, 0.76% to 2.2% for stability, and 0.61% to 1.9% for repeatability, all indicating good method performance.
3.2.4 Recovery
Average recoveries ranged from 87.1% to 96.5% (echinacoside), 88.4% to 109.7% (tubuloside A), 94.1% to 105.1% (acteoside), and 96.9% to 115.1% (isoacteoside), demonstrating satisfactory accuracy.
3.3 Real Sample Analysis: TLC‑ImageJ vs. HPLC
The TLC‑ImageJ method was applied to quantify the four PhGs in 51 batches of Cistanche tubulosa and 8 batches of Cistanche deserticola. Quantitative results were validated against HPLC analysis using paired t‑tests, which showed no statistically significant differences between the two methods for all four PhGs in C. tubulosa and for echinacoside and acteoside in C. deserticola (P > 0.05).
The results confirmed that TLC‑ImageJ can accurately quantify not only the pharmacopoeial marker components (echinacoside and acteoside) but also tubuloside A and isoacteoside, which are not typically included in routine quality control. The good agreement between TLC‑ImageJ and HPLC validates the feasibility of this rapid analytical approach for Cistanche quality analysis.
3.4 Advantages of the TLC‑ImageJ Method for Cistanche Quality Analysis
The TLC‑ImageJ method offers several key advantages:
No additional staining step – spots are directly visible under 365 nm UV light as blue fluorescence.
High throughput – 8–10 samples can be analyzed simultaneously on a single TLC plate.
Rapid analysis – complete quantitative analysis within 30 minutes.
Portable and low‑cost – requires only basic TLC equipment and a smartphone, eliminating dependence on fixed laboratory facilities.
Versatile – applicable to multiple PhGs beyond pharmacopoeial markers, enabling comprehensive quality analysis.
For Cistanche tubulosa extract suppliers like Chengdu Wecistanche Bio-Tech Co., Ltd., this method provides a practical tool for rapid in‑process and final product quality analysis, ensuring consistent PhG content across batches to meet the high standards expected by the nutraceutical, functional food, and pharmaceutical industries in the US and European markets.

4. Conclusion
This study established a TLC image digitalization method for the rapid quantitative analysis of four major phenylethanoid glycosides in Cistanche: echinacoside, tubuloside A, acteoside, and isoacteoside. The method aligns with the physicochemical properties of the target compounds, requires no additional staining, and enables simultaneous analysis of 8–10 samples on a single TLC plate within 30 minutes. The quantitative results obtained by this method are consistent with those from HPLC, validating its accuracy and reliability.
The method is particularly well‑suited for primary testing applications and field‑based quality analysis, as it relies on portable, low‑cost equipment and reduces dependence on laboratory infrastructure. It has already been implemented in Cistanche cultivation, processing, and research facilities in Xinjiang, China, demonstrating its practical utility.
Wecistanche Factory for cultivating and processing cistanche

Supportive Service Of Wecistanche-For more details about cooperation
Email:wallence.suen@wecistanche.com
Chengdu Wecistanche Bio-Tech Co., Ltd. , the world's largest Cistanche processing company, is proud to apply and promote this advanced yet accessible quality analysis methodology. With our 200,000‑acre Cistanche base, GMP‑certified production facilities, and state‑of‑the‑art membrane separation technologies, we deliver premium Cistanche tubulosa extracts with naturally higher levels of phenylethanoid glycosides-up to industry‑leading specifications. Our products meet US and EU international quality standards and are suitable for a wide range of applications, including TCM decoctions, functional foods, healthcare products, dietary supplements, pharmaceuticals, and cosmetics.
As global demand for Cistanche supplements continues to grow-with the market projected to reach $1.13 billion by 2033, driven by increasing consumer interest in natural anti‑aging, cognitive health, and vitality products-the importance of reliable, rapid quality analysis methods becomes paramount. The TLC‑ImageJ method presented here provides a practical solution for manufacturers, suppliers, and regulatory bodies to ensure consistent product quality, thereby supporting the continued expansion of the Cistanche industry in the United States, Europe, and beyond.
References
[The original references have been preserved and adapted as appropriate for the English translation.]
Chengdu Wecistanche Bio-Tech Co., Ltd.
Website: www.xjcistanche.com
Specializing in high‑phenylethanoid‑glycoside Cistanche tubulosa extracts
Certified with SC, HACCP, SOCA, NOP (US Organic Program), and International Organic Crop Improvement Association (OCIA) certifications
US and EU market compliant