Nano Milk Protein-Mucilage Complexes: Characterization And Anticancer Effect Part 2
Mar 19, 2022
For more information, contact tina.xiang@wecistanche.com
Click the link to learn part 1: https://www.xjcistanche.com/news/nano-milk-protein-mucilage-complexes-characte-55049142.html
3. Materials and Methods
3.1. Materials
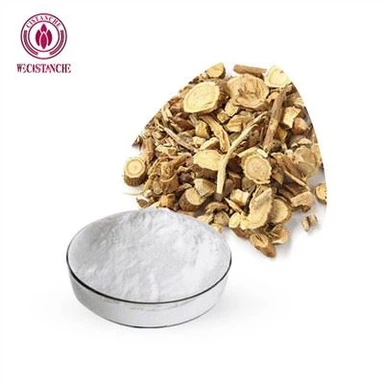
Plantago ovata (subgoal) husk and the ripening fruit of Ziziphus Spina-Christi(Nabeq)were purchased from Giza, Egypt; milk protein concentrate (MP,81.3% protein) was purchased from Fonterra company(Auckland, New Zealand). The casein and whey proteins in MPC are largely in their native and similar, micellar, form to those found in milk. All chemicals used were of analytical purity.
3.2.Preparation of Isabgol Husk Mucilage (IHM) and Nabeg Mucilage (NabM)
Isabgol husk mucilage (IHM) and Nabeq mucilage (NabM)were prepared according to the method described by El-Maksoud et al. [5]. Briefly, a suspension of isabgol husk was prepared by dissolving 1.2 g in 100 mL distilled water and purified with acetone solution. The resulting gel was stored in the refrigerator (4-5°C) until used.
For NabM, the ripened Nabeq fruits were thoroughly washed with tap water to remove dirt. The fresh fruits were separated from the seeds and mixed with distilled water at a ratio of 1:10(w/v) after being cut into small pieces. The mixture was blended using a laboratory blender(Toshiba Mixie, Japan) and allowed to stand for 12 h in the refrigerator.
The mucilaginous extract was then centrifuged at 2000 rpm for 30 min and filtered through a muslin cloth. The resulting viscous soluble mucilage was precipitated with acetone. The crude mucilage obtained was stored in the refrigerator until used.
For analytical purposes, the mucilage was dried in an air oven at 40°Cand ground using ball mill MM400(Retsch, Germany). The chemical composition of psyllium husk mucilage powder (PHMP) and Nabeq mucilage powder (NabMP) has been measured. The moisture, protein, fat, ash, crude fiber, and total carbohydrate contents were 8.49, 0.34,0.21,2.13,1.53,and87.44% for PHMP and 9.18,4.72,2.05,2.69,1.70,and78.26% for NabMP, respectively. The resultant powder was stored at a cool temperature (4-5°C) until further analysis.

Click to learn more information
3.3. Preparation of Milk Protein-Mucilage Complexes(MPMC)
Milk protein (MP) complexes with IHM and NabM were prepared according to Morr et al.with some modifications [44]. Milk protein concentrate was reconstituted in distilled water(10%). The resultant milk protein colloid was mixed with IHM and NabM at a 1:3 (o/o) ratio. The pH of the mixture was adjusted to 10 and left to stand for 10 min. After that, the pH was lowered to 3.5 using 0.1 N HCl and left for another 10 min. The pH was then adjusted to pH 4.6 using 0.5 M NaOH to collect MPMCby filtration on a filter paper: MP, as well as the resultant MPMC, were dried by lyophilization at -45℃C for 24h using the Novalyphe-NL500 lyophilizer, Savant Instruments, Holbrook, NY, USA.
3.4. Physicochemical and Functional Characteristics
3.4.1.pH Measurement
The pH of the resulting products at 10% solution was measured using a calibrated pH meter (HANNA, HI 902 m, Germany).
3.4.2.Determination of Bulk Density (BD), Tapped Density (TD), and Carr's Index
MPMC powder was poured into a 50 mL measuring cylinder up to 25 mL, corresponding to the untapped volume, and then tap 5-10 times until no further change of the powder's volume was noted corresponding to the tapped volume.
The bulk density, tapped density, and Carr's index were determined applying the following equations [45]:
(1)BD = mass/ untapped volume
(2)TD = mass/tapped volume
(3)Carr's index (%)= (TD-BD)/TD×100
3.4.3. Water Absorption Index(WAI) and Water Solubility Index (WSD)
Water solubility and water absorption indices of MP and MPMC were examined according to the method described by Yagc and Gogus with some modifications [46]. The samples(0.5 g)were dispersed in 10 mL distilled water at 25°Cin a centrifuge tube. After standing for 30 min, with tube inversion every 5 min, the samples were centrifuged at 3500 rpm for 15 min. The filtrate was transferred onto an aluminum plate and dried for 3 hr at 105°C. The weight of the remaining gel was recorded and WSI and WAI were determined as follows:
(4)WAI(g/g)= Weight gain of gel/Dry weight of the sample
(5)WSI%= Weight of dry solids in supernatant ×100/Dry weight of the sample
3.4.4. Milk Protein Digestibility
Protein digestibility was determined according to Abd El-Ghany et al. [47]. Briefly, MP and MPMC samples were dispersed in distilled water at a concentration of 6.38 mg/mL, and the pH was adjusted to 8.0. One milliliter of freshly prepared enzyme stock solution (1.6 mg/mL trypsin, 3.1 mg/mL chymotrypsin, and 1.3 mg/mL ER amino peptidase1
(ERAP1)was mixed with protein suspension at 37°C. The pH was recorded after 10 min, and enzyme activity was determined using casein as a reference. The following equation was used to calculate protein digestibility [47]:
(6)% Digestibility = 210.46-18.10 (pH)
3.5.Phenolic Fractions of PHM and NabM
Phenolic compounds of mucilage samples using HPLC analysis were conducted by the protocol described by Elsayed et al. [48]. Briefly, the mucilage extract was analyzed using an Agilent 1260 series HPLC system (Agilent Technologies Inc., Santa Clara, CA, USA). The separation was passed using the C18 column (100 mm×4.6 mm i.d.,5 um). The mobile phase contained (A) water 0.2% H3PO4, (B)methanol, and(C) acetonitrile at a flow rate of 0.6 mL/min. Gradient elute was as per the next scheme: 0-11 min (96%A., 2% B);11-13 min (50% A,25%B);13-17min (40% A,30%B);17-20.5 min (50%B,50%C);and 20.5-30 min (96% A,2% B).The detection wavelength (UV detector,284 nm) was set at 284 nm. The injection size was 20 μL and the column temperature was maintained at 30°C. Compounds were known by comparing their retention time with those from authentic standards. Calibration curves were utilized to evaluate the compound amounts.
3.6.Total Phenolic and Flavonoid Content of MP and MPMC
Polyphenolic content was determined by the Folin-Ciocalteu method with some modifications [5]. In brief,2.8 mL milli-Qwater containing 10 mg of MP or MPMC were mixed with 2 mL of 2% sodium carbonate, and 0.1 mL of 50% Folin-Ciocalteau reagent. After 30 min of incubation at room temperature, the absorbance of the reaction mixture was measured at 750 nm against deionized water as a blank using a spectrophotometer (Hitachi, Model 100-20). Gallic acid(GA)was used as a standard phenolic compound, and a seven points standard curve(0-200 mg/L)was constructed. The results were expressed as milligram gallic acid equivalents per gram protein (GAE/g).
Flavonoids content was determined using the aluminum chloride method as previously described by Abedelmaksoud et al. with some modifications [5]. In brief,2.8 mL milli-Q water containing 10 mg MP or MPMC was mixed with 0.1 mL of 10% aluminum chloride hexahydrate and 0.1 mL of 1 M potassium acetate. After incubation at room temperature for 40 min, the absorbance of the reaction mixture was measured at 415 nm against deionized water as a blank. Quercetin was used as a standard utilizing a seven points standard curve (0-50 mg/L).Total flavonoid content was expressed as milligram quercetin equivalents (QE/g).
3.7. Antioxidant Activity of MP and MPMC
The total free radical scavenging capacity of MP and MPMC was evaluated using three different antioxidant assays: Stable 2,2-diphenyl-1-picrylhydrazyl(DPPH), Azino-bis(3-ethylbenzothiazoline-6-sulphonic acid (ABTS), and Hydroxyl radical (HS) radicals as previously described by El-Maksoud et al. [5].
3.8. Amino Acids Profile of MP and MPMC
Protein samples were acid hydrolyzed using 6 N HCl according to Peksa et al. [49. An automated amino acid analyzer(AAA 400, INGOs Ltd.)was used for determining amino acids.
3.9. Rheological Properties
Samples were prepared as described by Barnes [50]with some modifications. The viscosity of 2.5%(w/w)solution at pH7 was determined at 25±1°C using a Brookfield viscometer(DV-II+ Pro, Rheocalc Software, Germany). Stress (σ)and viscosity (n)were plotted as a function of shear rate. The consistency index(K) and the flow behavior index (n) of the power-law model were calculated:

The value of n equals 1 for Newtonian fluids and varies from 0 to 1 for fluids that are shear-thinning and greater than 1 for shear-thickening fluids [51].
3.10.Differential Scanning Calorimetry (DSC)
The thermal properties of MP and MPMC were measured using a differential scanning calorimeter(PerkinElmer, USA).Samples(4-6 mg)were placed in an aluminum plate and sealed. Each pan was then heated to 350°C with a flow of dry nitrogen gas at 20 mL min-I at a heating rate of 10°C min-1. From the endothermic peak of the DSC thermogram, the denaturation onset temperature, maximum transition temperature, and degradation point were estimated [52]. The transition enthalpy value(AH) from the area under the endothermic peak in the DSC curve was determined, and the empty aluminum pan was used as a reference.
3.11. Fourier-Transform Infrared Spectroscopy (FTIR)
Infrared spectra between 600 and 3500 cm-I were measured at 25°Cusing an FTIR spectrophotometer(QFA Flex, USA) by the attenuated total reflection method using a resolution of 4 cm-I and acquiring 10 scans per second.
3.12. Transmission Electron Microscopy
The microstructure of MP and MPMC was visualized using a transmission electron microscope (JEOL, JEM 1400 Flash, Japan) at 80 kV. The cryo-stage in the negative staining method was applied [53].

3.13.Biological Studies on MP and MPMC
3.13.1.In Vitro Anticancer Activity
All cell lines used in this experiment were obtained from the American Type Culture Collection(ATCC, Manassas, VA, USA). Two human cancerous cell lines were used in this assay: mammary adenocarcinoma (MCF-7, ATCCHTB-22TM)and hepatocellular carcinoma (HepG2, ATCC4 HB-8065TM). Non-cancerous skin fibroblast BJ-1(ATCC⑧ CRL-2522TM) and epithelial breast MCF-12F(ATCC CRL-10782TM) cell lines were also tested for comparison. Cell lines were grown in Dulbecco's modified Eagle's medium (DMEM/high glucose, HyCloneTM, USA)supplemented with 10% fetal bovine serum (FBS, Gibco, Brazil), 100 U/mL penicillin, 100 ug/mL streptomycin, and 25 ng/mL amphotericin B(Sigma, Oakville, ON, Canada) and cultured at 37°C with 5%CO, in a humidified incubator. The culture medium was replaced every other day with a fresh medium. When the cells reached 70% confluency, they were detached using 0.25% Trypsin-EDTA(1X) Gibco, Canada, and transferred to a new culture flask. After the second passage, the cells were trypsinized and plated in a 96-well plate at a concentration of 2×10* cells/well. After 24 h of incubation, the medium was decanted, and the cells were washed twice with PBS then treated with 200 μL of culture medium containing different concentrations of protein samples(1, 5,10, and 20ug/mL). Doxorubicin HCl(4 ug/mL)was used as a positive control, while cells treated with an unsupplemented medium were taken as a negative control. The plates were incubated at 37℃C for 24 h and the anti-cancer activity of the samples was determined using a neutral red uptake assay according to Repetto et al. [54]. Briefly, after the incubation period, the medium was replaced with 150 uL of neutral red dye(100 mg/mL) dissolved in a serum-free medium, and the cells were incubated at 37℃C for 3 h. Next, the cells were rinsed with PBS, and 150 μL of elution medium (EtOH/AcCOOH,50∶1)was added followed by gentle shaking for 10 min to ensure complete dissolution. Absorbance was measured at 540nm using a microtiter plate reader(BioTek,96 Well Plates, ELX808, USA).

where Ac is the absorbance of the control and As is the absorbance of the sample. Percentage cell death presented as cytotoxicity(%)and the concentration that kills 50% of cells (IC50)was calculated for each sample.
3.13.2.Determination of p53, Bax, Caspase-3, and Bcl-2 Proteins Level
The cellular levels of key apoptosis protein markers were determined after 24 h post-treatment with the ICso of MP and MPMC. Briefly, Hep G-2, MCF-7, Bj-1, and MCF-12F cells were seeded at 5× 10* cells/well in 6-well plates. After 24 h of incubation with the samples at 37 °C, cells were collected and lysed then centrifuged at 10,000rpm for 20 min at 4°C. Protein concentration was quantified in the supernatant by Bradford assay [55]. Caspase-3 activity was analyzed using a colorimetric assay kit(Abcam, ab39401)according to the manufacturer's instructions [56]. In brief, 10 mg protein was added to 50 uL of Caspase substrate and the final volume was adjusted to 200 μL using the reaction buffer at 37 °C, and the mixture was incubated for 1 h in the dark followed by measuring Caspase-3 concentration at 405 nm.
The level of pro-apoptotic marker p53, associated X(Bax), and anti-apoptotic marker B-cell lymphoma-2(Bcl-2)were determined in cell lysate using Enzyme-Linked Immunosorbent Assay Simple Step ELISA according to the manufacturer's instructions (ab207225, ab119506, and ab199080; Abcam, USA), respectively [57,58].
3.13.3.DNA Damage Induced by Oxidative Stress Protection
DNA damage assay was carried out as previously described by Leba et al. [59] with slight modification. In brief,3 μL of Ribonuclease inhibitor plasmid RNH1(NM_203387)Human Tagged ORF Clone 10 μg/μL were mixed with Fenton's reagent(5 mM of H2O2 and 0.3 mM of FeSO4 and 0.6 mM of EDTA), and the final volume was adjusted to 25 μL using phosphate buffer(H2POA, 8.3 mM, pH 7.4). Then, the solution was incubated for 20 min at 37°C. To assess the antioxidant protection capacity of MP and MPMC against DNA damage induced by Fenton's reagent, 5 μg/mL MP/NabM, MP/IHM, and MP were added before incubation. RNH1 plasmid DNA(3 μL, 10 μg/μL) was used as DNA protection control.
3.13.4.PCR-Based Genomic DNA Damage Assay
Homo sapiens methylenetetrahydrofolate reductase (MTHFR) gene was amplified using PCR from blood genomic previously extracted from healthy blood samples using a standard DNA extraction kit [60]. DNA was incubated for 10 min with or without Fenton's reagent supplemented with MP or MPMC. A 198-bp fragment was amplified using forward5'-TGAAGGAGAAGGTGTCTGCGGGA-3' and reverse 5'-AGGACGGTGCGGTGAGAGTG-3'primers. Using 50ng of treated DNA, PCR amplification was carried out following next thermocycler(94°C for 5 min, followed by 25cycles of denaturation, the 30s at 94°C; annealing, 30s at 60°C; and extension,30 s at 72°C)for 25 cycles and 1 final extension cycle at 72°C for 5min. The PCR reaction samples were applied for agarose gel electrophoresis (2%).
3.13.5. Gene Expression Profiling by RT-qPCR
Analyses of gene expression of key pro-and anti-apoptotic marker genes were conducted with HepG-2, MCF-7, Bj-1 and MCF-12F cells exposed to IC50 obtained data (Table 3)for 72 h. Briefly, total RNA was extracted using the Total RNA Purification Kit(QIAGEN., Thorold, ON, Canada) according to the manufacturer's instructions. cDNA
synthesis was carried out as previously described by Aboul-Sound et al. [61]. Amplification programs and PCR amplicon specificity were performed and assessed by the use of a Rotor-Gene O 5-Plex HRM thermal cycler (Qiagen, Germany) with Quanti-Tect SYBR-Green PCR Kit (Qiagen, Germany) as previously documented following standard protocols [61]. The following primers were used: Hs_P53_1 SG QuantiTect Primer Assay (QT00060235); Hs_CASP3_1_SG Quan-tiTect Primer Assay (QT00023947); B-cell lymphoma 2 Hs_BCL2_1_SG QuantiTect Primer Assay (QT00025011);Bcl-2-like protein Hs_BAX_1_SG QuantiTect Primer Assay (QT00031192); and 18S rDNA house-keeping (HK) gene Hs_RRN18S_1_SGQuantiTect Primer Assay(QT00199367). PCR thermal cycling program and gene expression analysis to determine the fold-change relative to the 18S gene were essentially performed as previously reported [61].
3.14.Statistical Analysis
The obtained results were expressed as mean ± standard deviation. Statistics were achieved using SPSSsoftware 11.5 (SPSS, Inc.Chicago, IL, USA). Duncan's multiple range test was used to determine the significant differences among all samples, and differences were considered significant at p<0.05.

4. Conclusions
In conclusion, this study revealed that mixing milk protein with polysaccharides through the differentiation of solution pH is a suitable technique for complexation. The resulting milk protein mucilage complexes (MPMC) have significantly higher phenolic and flavonoids contents than the milk protein (MP).DSC results showed that the complexation of MP with polysaccharides significantly increased the thermal stability with a shift in denaturation temperature. FTIR analyses were performed to identify the functional groups, and the flow behavior of the prepared complexes was investigated. The WSI and WAI of milk protein were increased by complexation with NabM or IHM. TEM was used to visualize the microstructure of the prepared complexes. On the other hand, the resulting milk protein complexes with isabgol husk mucilage (HM) or Nabeq mucilage(NabM) are expected to outperform the native milk proteins in the antioxidant and anticancer effect. In summary, the MPMCexpressed unique anticancer properties against model breast cancer and hepatic carcinoma cell lines (MCF7 and HEPG2, respectively)as proven by a neutral red uptake assay.
MPMC enhanced both antioxidant and anti-proliferation activity. Caspases are key regulator proteins that are implicated in apoptosis induction. Upregulation of caspase 3 protein and mRNA transcripts (Figure 9A, B) control other proteins in the pathway of apoptosis, which is characterized by the collapse of the mitochondrial membrane with Bax-induced cytochrome c release and activation of caspase 9leading to the subsequent engagement of caspase 3. Up-regulation of Casp3, p53, and Bax, along with reduction of Bcl-2 expression revealed that MPMCinduced apoptosis induction, where upregulation of p53 will stimulate expression of Bax, which, in turn, will induce cytochrome c release, followed by caspase-9 and-3 activation. Moreover, Bcl-2 is known to inhibit cytochrome c release. In our study, MPMC-induced Bcl-2 downregulation was shown to facilitate unopposed Bax-induced cytochrome c release and subsequent apoptosis.
The anticancer effect of protein-polysaccharide complexes provides further enlightenment on the applicability of these complexes to be used in the development of affordable and efficient cancer therapies with minimal side effects.