Enhanced Adsorption Efficiency Of Phenylethanoid Glycosides On Mesoporous Carbon
Jul 08, 2024
INTRODUCTION
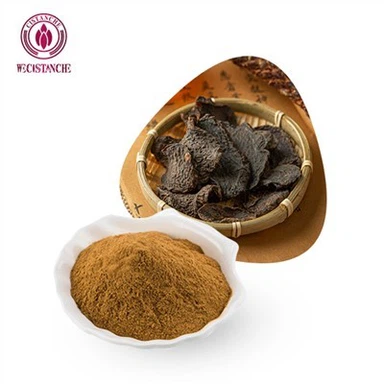
Cistanche tubulosa was an Orobanchaceae parasitic plant (Li et al., 2016; Wang X. et al., 2017), and it mainly grew on the roots of Tamarix plants and Calotropis species (Zhang W. et al., 2016; Yan et al., 2017). Cistanche tubulosa was originally recorded in Shen Nong's Chinese Materia Medica in ca. 100 B.C. The growth and cultivation of Cistanche tubulosa required severe environmental conditions, and it was widely planted in arid lands and deserts of the northern hemisphere, such as the provinces of Xinjiang, Inner Mongolia, Gansu, Qinghai, and the Ningxia Autonomous Region in China (You et al., 2016). Cistanche tubulosa was a precious Chinese tonic herb which had the functions of nourishing the kidney, anti-aging, boosting the essence of blood, and moistening the large intestines to free stool (Gu et al., 2016; Shimada et al., 2017; Cui et al., 2018), and it has been reputation as "Ginseng of the Deserts" (Song et al., 2016; Wang et al., 2018). Cistanche tubulosa was officially recorded in the Chinese Pharmacopeia as the authentic source of Cistanches Herba (Chinese name: Roucon-strong) from the 2005 edition (Wang T. et al., 2016; Pei et al., 2019).

NATURAL CISTANCHE TUBULOSA FOR IMPROVING SEXUAL FUNCTION PHGS75% ECH 30% ACT 12%
Previous studies have revealed several main chemical constituents of Cistanche tubulosa, including PhGs, iridoids, and polysaccharides (Li et al., 2018a). The structures of PhGs were mainly composed of cinnamic acid and phenyl ethyl alcohol that were attached to a β-glucopyranose through ester and glycosidic linkages (Luo et al., 2010), and PhGs have been regarded as the major active components of Cistanche tubulosa possessing various pharmacological activities (Liao et al., 2018). The study showed that PhGs had a variety of medicinal properties, such as neuroprotection, immune regulation, anti-inflammatory, liver protection, and antioxidant (Aiello et al., 2015; Shiao et al., 2017; Wu et al., 2018, 2019). According to phytochemical evaluations, PhGs such as echinacoside, and acteoside were considered to be the main active components and markers of Cistanche tubulosa (Li et al., 2017b), which were usually chosen as marker compounds for the quality evaluation of Cistanche tubulosa and the species of Cistanche were distinguished through these compounds. PhGs were naturally occurring water-soluble compounds because they had many hydroxyl groups and phenolic hydroxyl groups in the molecule. Thus, the PhGs can be separated from Cistanche tubulosa in an aqueous solution.
Many methods for the separation and purification of natural products have been developed including adsorption (Liu et al., 2016), membrane separation (Zhang et al., 2018b; Li et al., 2019) and solvent extraction, and so on (Li et al., 2015a,b; Wang S. et al., 2016; Zhang H. et al., 2016). However, membrane separation and solvent extraction were not suitable for largescale preparation and they were difficult to achieve high recovery of the products (Zhang et al., 2018a). Adsorption was one of the most widely adopted methods for the separation of natural products (Wang S. et al., 2016; Konggidinata et al., 2017). Owing to their unique and tunable pore structures, high surface areas, and mechanical stability, mesoporous carbons (pore size between 2 and 50 nm) have been proven to be a kind of efficient adsorbents for adsorptive natural products. The study showed that mesoporous carbons were more suitable for adsorbing macromolecules, such as mesoporous carbons have been used by Qin et al. for the enrichment of chlorogenic acid from eucommia ulmoides leaves (Qin et al., 2018). Li et al. synthesized two mesoporous carbons via a hydrothermal treatment approach and evaluated the adsorption performance of two mesoporous carbons for berberine hydrochloride and marine from water (Li et al., 2018b). It was considered to be kind of promising material as a highly efficient adsorbent (Zhang et al., 2013; Tian et al., 2015; Zhou et al., 2016). Additionally, mesoporous carbons also have been applied to the adsorptive removal of aromatic compounds, dyes, and heavy metals from wastewater (Kong et al., 2016). In previously published works, Liu et al. used a macroporous resin to adsorb PhGs from Cistanche tubulosa, and the purity of the PhGs increased but the adsorption capacity and desorption rate were low. Compared with macroporous resin, mesoporous carbons had the characteristics of a large specific surface area, suitable pore size, and a high pore volume. Therefore, mesoporous carbon was considered to be a highly efficient adsorbent for PhGs. In this study, the three kinds of mesoporous carbon were selected as adsorbents for the separation and purification of PhGs from Cistanche tubulosa.
This work's main objective was to explore the adsorption performance of CMK-3 for the separation and purification of PhGs from Cistanche tubulosa. The effects of different concentrations, pH, and temperature on the adsorption performance of CMK- 3 were investigated and optimal adsorption conditions of PhGs were screened out. Mesoporous carbons were characterized by FT-IR, BET, TEM, and TGA, and adsorption isotherms and kinetics were performed and analyzed in detail.

NATURAL CISTANCHE TUBULOSA FOR IMPROVING SEXUAL FUNCTION PHGS75% ECH 30% ACT 12%
EXPERIMENTS
Materials and Reagents
Cistanche tubulosa stem was purchased from Congrongtang Biological Technology Co., Ltd. (Xinjiang). The standards of echinacoside (purities ≥ 98%) and acteoside (purities ≥ 98%) were purchased from Sunny Biotech Co., Ltd. (Shanghai). Acetonitrile, methanol, and acetic acid of HLPC were purchased from Thermo Fisher Scientific Co., Ltd. (Shanghai). The ethanol of analytical grade was purchased from Yongsheng Fine Chemical Co., Ltd. (Tianjin). Ordered mesoporous carbon (CMK-3), disordered mesoporous carbon (DMC), and threedimensional cubic ordered mesoporous carbon (CMK-8) were purchased from Xianfeng Nano Material Technology Co., Ltd. (Nanjing).
Characterization
The morphology and microstructures of the prepared samples were investigated using Transmission electron microscopy (TEM, Tecnai G2 F20) operated at 200 KV. The TEM samples were prepared under ambient conditions by depositing droplets of the ethanol solution with the mesoporous materials onto carbon films supported by Cu grids. Generally, a light source with a shorter wavelength was selected to increase the resolution of the microscope, and the structure of the mesoporous carbons can be observed. The surface functional groups were qualitatively measured by Fourier transform infrared spectroscopy (FT-IR, AVATAR360) using the interaction between infrared radiation and matter molecules. FT-IR uses an attenuated total reflection method test, the conditions were a step size of 2 cm−1 and a scanning range was 4,000–400 cm−1. The physical structure data such as the specific surface area, pore size, and pore volume of the mesoporous carbons calculated by Brunauer-Emmett-Teller (BET, ASAP 2460). The procedure for the adsorbent was as follows: mesoporous carbons were degassed at 60◦C for 12 h, and the N2 adsorption-desorption curves were tested at −196◦C to calculate the specific surface area, pore size, and pore volume of the mesoporous carbon. Thermo gravimetric analyzer (TGA, STA 449 F3) is an instrument that uses the thermo gravimetric to detect the temperature-mass relationship of a substance, and TGA measures the mass of a substance as a function of temperature under program temperature control. TGA data was obtained using a TGA in the temperature ranging from 30 to 800◦C at a heating rate of 10◦C/min under an air atmosphere.
HPLC Analysis
The content of echinacoside and acteoside was detected by high-performance liquid chromatography (HPLC, Waters Co., USA). The system included an autosampler, high-pressure pump, and ultraviolet (UV) detector. The analysis was conducted on a symmetry C18 column (100Å, 5µm, 4.6 × 250 mm). HPLC used the gradient elution method to separate and detect samples. The volume of the injection loop was 10µm, the column temperature was 30◦C, the detection wavelength of the UV spectrophotometer was 330 nm, the flow rate was 1 ml/min and the mobile phase was (A) acetonitrile and (B) acetic acid/water (1:44, v/v).
Adsorption Equilibrium
The optimization experiment of the adsorption condition for CMK- 3 has been carried out using a mixture of acteoside and enchanoside and under the optimal conditions, the crude extract of Cistanche tubulosa was carried out on the adsorption cycle experiment and all adsorption experiments were repeatedly carried out at least 3. In the same batch of experiments, mesoporous carbons of CMK-8 and DMC were run in parallel with the CMK-3. The three kinds of mesoporous carbon (CMK- 3, DMC, and CMK-8) each 10 mg were added to the three bottles, respectively. Then 15 mL sample solution with an initial concentration of C0 (mg/mL) was added to the bottle. The bottle was placed in a constant temperature shaker of 30◦C for 24 h until the adsorption equilibrium was reached. Then 1 ml of adsorption solution was filtered through a 0.22µm filter and the equilibrium concentration Ce (mg/mL) of the sample solution was determined by HPLC.
Desorption Experiment
Then the desorption experiment of mesoporous carbon was carried out. The adsorbed mesoporous carbon under 15 mL of methanol/acetic acid (9:1, v/v) mixed solution, which was placed in the water bath of ultrasonic for 1 h at 30◦C. The obtained desorption solution was filtered by a 0.22 filter before analyzing by HPLC.
The adsorption capacity qe (mg/ml) was evaluated as follows:

where V is the volume of the solution (mL) and W is the weight of the mesoporous carbons (g).
RESULTS AND DISCUSSION
Characterization
Figure 1 shows a TEM of the three kinds of mesoporous carbons. DMC was a disordered porous network, CMK-8 was a network structure of three-dimensional porous, and CMK-3 was a striped structure with ordered one-dimensional pore, which was similar to the reported results (Wang et al., 2006; Luo et al., 2010).
Figure 2 shows the FT-IR spectrum of the mesoporous carbons (CMK-3, DMC, and CMK-8) and the FT-IR spectrum before and after CMK-3 adsorption. It can be seen from Figure 2A that the functional groups on the surfaces of the mesoporous carbons were mainly oxygen-containing. The overall shapes of the spectra for the three kinds of mesoporous carbons were similar. The mesoporous carbons showed a peak band at 3,423 cm−1 referring to the stretching vibration band of O-H. The bands in the region of 1,580 and 1,629 cm−1 correspond to stretching vibrations of the carbonyl and carboxyl C=O. Additionally, the peak occurring at 1,384 cm−1 was found to be stretching vibrations of alcoholic C-O, and the tensile vibration at 2,922 and 2,852 cm−1 correspond to the C-H on methylene and methyl groups, respectively. This indicated that the oxygen-containing groups existing on the surfaces of the mesoporous carbons might lead to a weak chemical interaction between PhGs molecules and the mesoporous carbons.
Figure 2B shows the FT-IR spectra of CMK-3 before and after adsorption, acteoside, and enchanoside. The characteristic peak at 1,697 cm−1 derived from the C=C of olefin in acteoside and enchanoside, while the bands in the region of 1,519–1,423 cm−1 corresponded to the stretching vibration peak of the aromatic ring C=C in acteoside and enchanoside. The tensile vibration at 1,604 cm−1 was the C=O bond and the peak at 1,157 cm−1 was caused by the stretching vibration of the ether bond in acteoside and enchanoside. Compared with the FT-IR spectrum of CMK-3 before adsorption, the FT-IR spectrum of CMK-3 after adsorption appeared the new peaks, which belonged to the characteristic peaks of acteoside and enchanoside.
The N2 adsorption-desorption isotherms were an important parameter for the adsorption of PhGs on CMK-3 and the comparison of adsorbent structure. Figure 3 shows the N2 adsorption-desorption isotherms of CMK-3, CMK-8, DMC, and CMK-3 after PhGs adsorption, respectively. As can be seen from Figure 3, the isotherm of the mesoporous carbons was similar to type-IV isotherm in that this type of isotherm was predominantly mesoporous, in which the range of pore size was between 2 and 50 nm (Sanz Pérez et al., 2019). The gap between adsorption and desorption isotherm was referred to hysteresis loop caused by capillary condensation reaction. For capillary condensation reactions, capillary condensation occurs first in the smallest pores (Barsotti et al., 2016). This shows that CMK-3 had a smaller mesopore than does DMC and CMK-8, which was consistent with the results of Table 1. The isotherm of CMK-3 exhibits an H1 hysteresis loop that was indicative of the rapid pore filling associated with capillary condensation and the pore structure of CMK-3 was reasonably orderly. The isotherm of DMC exhibits an H3 hysteresis loop, this type of hysteresis had disordered pores due to a network of pores that caused an undefined structure of porous adsorbent. CMK-8 isotherms exhibit an H2 hysteresis loop, indicating that pore structure was complicated and pore size distribution was uneven.
The N2 adsorption-desorption isotherms of CMK-3 were compared before and after the adsorption of PhGs. The isotherm of the CMK-3 after adsorption was also similar to the type-IV isotherm in Figure 3B. It indicated that the CMK-3 maintained its mesoporous structure after the adsorption. As can be seen from Table 1, the specific surface and pore volume of CMK-3 after adsorption exhibited a marked decrease, the specific surface area of CMK-3 before and after adsorption decreased from 1,098.02 to 227.75 m2 /g, and the pore volume of that reduced from 1.32 to 0.42 cm3 /g. It indicated that PhGs molecules were adsorbed on CMK-3.
Table 1 summarizes the BET-specific surface area, pore volume, and pore size of the four samples. The BET surface areas of CMK-3, DMC, and CMK-8 were 1,098.02, 430.42, and 596.00 m2 /g and the pores volume were 1.32, 0.70, and 0.85 m3 /g, respectively. The pore size of CMK-3 was 4.31 nm, lower than that of CMK-8 (9.58 nm) and DMC (5.18 nm). It can be seen that the pore volume and specific surface area follow the order: CMK-3 >CMK-8 >DMC, while pore size follows the order: DMC >CMK-8 >CMK-3.


Figure 4 shows the TGA curves of the three kinds of mesoporous carbons (CMK-3, CMK-8, and DMC). As can be seen from Figure 4, the three kinds of mesoporous carbons all have two distinct stages of mass loss: the first stage of mass loss was due to the evaporation of moisture in the mesoporous carbons before 100◦C, the second mass loss stage of CMK- 3, DMC and CMK-8 approximately occurs at 660, 427, and 615◦C, respectively, which corresponds to the oxidative thermal decomposition of mesoporous carbons materials. It can be seen that the thermal decomposition temperature of CMK-3 was higher than CMK-3 and CMK-8, and the thermal stability of CMK-3 was better than that of CMK-8 and DMC.


Comparison of the Three Mesoporous Carbons Adsorption Performance Because the three adsorbents are mainly composed of carbon, the adsorption interaction between PhGs and the mesoporous carbons was considered to be the same. Therefore, it was considered that the difference in adsorption performance was derived from the difference in the physical structure of mesoporous carbons. Table 2 shows the adsorption performance of the three kinds of mesoporous carbons. It can be seen from Table 2 that the three kinds of mesoporous carbons all can adsorb PhGs, and CMK-3 had better adsorption performance than CMK-8 and DMC. This indicates that the pore size of mesoporous carbons was larger than PhGs molecules, and pore size was not the main factor to affect the adsorption capacity for three mesoporous carbons. The adsorption capacity and desorption rates of CMK-3 were up to 189.37 mg/g and 94.96%, respectively. The adsorption capacity of CMK-3 was higher than that of CMK-8. Because the pore volume and specific surface area of CMK-3 were larger than DMC and CMK-8, it indicated that the pore volume and specific surface area were the main factors to affect the adsorption performance.

Optimization of Adsorption Conditions The optimization of the adsorption experiment for CMK-3 has been carried out using a mix of both acteoside and enchanoside. Temperature, pH, and concentration were the main influencing factors of CMK-3 adsorption performance. Thus, the effects of these three influencing factors on CMK-3 adsorption performance were investigated.

Effect of Sample Concentration on Adsorption Performance of CMK-3
The effect of sample concentration on the adsorption performance of CMK-3 is shown in Figure 5. As the concentration increases, the capacity of adsorption increases. The adsorption capacity no longer increases with the increase of the sample concentration when the sample concentration was reached at 0.41 mg/g. At low initial concentrations of the sample, the adsorbent active sites were sufficient for the adsorption of a relatively small amount of PhGs molecules. In contrast, at a high initial concentration of the sample, the fixed amount of active sites on the adsorbents was not able to adsorb increasing the amount of PhGs molecules. Thus, the adsorption capacity of CMK-3 for PhGs molecules tends to be balanced.

NATURAL CISTANCHE TUBULOSA FOR IMPROVING SEXUAL FUNCTION PHGS75% ECH 30% ACT 12%
Effect of pH on Adsorption Performance of CMK-3
Figure 6 shows the effect of pH on the adsorption performance of CMK-3. It can be seen from Figure 6 that the optimal pH value was 6 for the adsorption of PhGs by CMK-3. The reasons are as follows: PhGs had a large number of phenolic hydroxyl groups and belonged to weak acidic molecules, and the different pH values affected the ionization and stability of the PhGs molecules. The ionization of phenolic hydroxyl groups would be inhibited at a low pH value, while the stability of phenolic hydroxyl groups on PhGs would decrease at a high pH value. The inhibited ionization of phenolic hydroxyl groups on PhGs resulted in a decrease in the electrostatic interactions between PhGs and CMK-3, decreasing the adsorption performance of CMK-3 for PhGs. Thus, the optimum pH was 6 for CMK- 3 adsorption.

Effect of Temperature on Adsorption Performance of CMK-3
Temperature was an important parameter in the adsorption process. Temperature not only affects the diffusion of PhGs molecules at the external boundary layer interface but also inside the adsorbent pores. Figure 7 shows the effect of temperature on the adsorption capacity of CMK-3. The adsorption capacity of CMK-3 increases with temperature increased from 30 to 60◦C. It has been reported the main reason was that the active site increases with increasing temperature due to the endothermic nature of the process, and the intra-particle diffusion of the adsorbents increased with the increase of the adsorption temperature (Peng et al., 2015). In addition, the mobility of the PhGs molecules increased and their diffusion resistance decreased with increasing temperature. The adsorption capacity decreases with increasing temperature when the temperature is 60–80◦C. It indicated that the adsorption temperature had an optimum value and that PhGs molecules may be instability at high temperatures. Therefore, the optimum adsorption temperature was chosen to be 60◦C.
The optimum adsorption conditions of CMK-3 were as follows: the sample concentration was 0.41 mg/g, the solution pH was 6, and the adsorption temperature was 60◦C. Under optimal conditions, the adsorption capacity of PhGs in crude extract on the CMK-3 was 358.09 ± 4.13 mg/g, which was more than three times the adsorption capacity of PhGs on macroporous resins (HPD300, 94.93 mg/g) (Liu et al., 2013). Meanwhile, the desorption rate of CMK-3 was 94.67% higher than that of macroporous resin.
Adsorption Isotherms
The adsorption isotherms are shown in Figure 8A. With the increase of equilibrium concentration, the adsorption capacity for PhGs increased and reached saturation status. To further understand the adsorption performance of PhGs on CMK-3, the adsorption isotherms of CMK-3 were investigated using Langmuir and Freundlich models. The parameters of adsorption obtained from different models provide some useful information on the adsorption mechanisms. Figures 8B, and C depicted the CMK-3 adsorption isotherms modeled by the Langmuir and Freundlich model.
The Langmuir model was based on the assumptions that adsorption takes place at specific homogeneous sites within the adsorbent, no significant interaction occurs among adsorbed species, and the adsorbent was saturated after one layer of

adsorbent molecules forms on the adsorbent surface. The linearized Langmuir isotherm equation can be written as follows:

The Freundlich model was commonly used to describe the adsorption characteristics of multilayer and heterogeneous surfaces (Wu et al., 2017). Its linearized form is given as follows:

where qm (mg/g) is the theoretical maximum monolayer adsorption capacity, KL (mL/mg) is the Langmuir constant related to the adsorption energy reflecting the affinity between the adsorbate and adsorbent (Wu et al., 2017; He et al., 2019), KF [(mg/g)•(mL/mg)1/n ] and n are the Freundlich constants. KF is an indicator of the relative adsorption capacity, n is related to the magnitude of the adsorption driving force and heterogeneity of the binding sites, and 1/n indicates the favorability of the adsorption.
The parameters of the isotherm models are summarized in Table 3. The Langmuir model was better than the Freundlich model for describing the adsorption data of PhGs on CMK-3, which indicated that the adsorption of the PhGs on the CMK-3 was a simple monolayer adsorption process (Wang F. et al., 2017). In addition, the presence of oxygen-containing


functional groups on the surface of CMK-3 enhanced the adsorption of PhGs. The maximum adsorption amount (qm) can reach 380.70 mg/g which was similar to the experimental value. In addition, the 1/n value of PhGs was calculated to be 0.22, which was <0.5. It indicated that the adsorption of the PhGs on the CMK-3 could take place easily (Fu et al., 2007; Gan et al., 2018). This indicated that the adsorption of PhGs on CMK-3 was not completely a physical adsorption process. PhGs contain multiple hydroxyl groups which might form hydrogen bonds with the oxygen-containing functional groups on the CMK-3 and offer weak chemical adsorption for the adsorption. Therefore, CMK-3 adsorption of PhGs was a complex adsorption process combining physical adsorption with chemisorption.
Adsorption Kinetics
CMK-3 adsorption capacities were investigated as a function of time to determine the adsorption equilibrium time in Figure 9A. The investigation shows that the equilibrium adsorption rate gradually decreases and is gradually leveled off as the adsorption capacity approaches equilibrium. It was found that the adsorption equilibrium was reached after 14 h. The rapid initial adsorption rate could be due to the high concentration gradient between the PhGs and CMK-3 in the solution and the surface of CMK-3 had large availability of active sites.
Adsorption kinetics was evaluated by the application of the pseudo-first-order, pseudo-second-order, and intra-particle diffusion models. The plotted graphs of pseudo-first-order, pseudo-second-order models, and intra-particle diffusion models for the adsorption of PhGs onto CMK-3 are shown in Figures 9B–D, respectively.

The linear form of the kinetics models is expressed as follows:
Pseudo-first-order (Li et al., 2017a):

Pseudo-second-order (Tang et al., 2018):

where K1 (1/min) and K2 (g/mg·min−1 ) are the rate constants of pseudo-first-order rate equation and pseudo-second-order rate equation, respectively. qe (mg/g) is the theoretical adsorption capacity at equilibrium.
Intra-particle diffusion model:

where Kp is the intra-particle diffusion constant (mg/g min) and C is the reflection of the boundary layer effect (mg/g).
The calculated values of qe, rate constants, and correlation coefficient are shown in Table 4. The pseudo-second-order model gave an R 2 value of 0.998, while the R 2 value of the pseudo-first-order model was 0.84. It implies that the pseudo-second-order model exhibits a better linear relationship than the pseudo-first-order model. Figure 9C shows that the linear plots of t/qe vs. t show good agreement with the experimental data from the pseudo-second-order model. The calculated qe of pseudo-second-order was quite similar to experimental data (Table 4). These results indicated that pseudo-second-order was a more suitable kinetics model than pseudo-first-order.
However, the evaluation results of the pseudo-second-order model cannot determine the potential adsorption mechanism. It was generally accepted that adsorption kinetics was controlled by the diffusion mechanism, which consists of external diffusion, boundary layer diffusion, and intra-particle diffusion (Wong et al., 2019). The intra-particle diffusion model was used to determine if intra-particle diffusion was the rate-limiting step.

The intra-particle diffusion was said to be the rate-limiting step when the qt vs. t1/2 was linear. The intra-particle diffusion was the only rate-controlling step when the curve passed through the origin. It can be seen from Figure 9D, the intra-particle diffusion was governed by two different stages. The first stage of the curve represents surface adsorption. The second stage indicates intra-particle diffusion in the CMK-3 pores. As the intra-particle diffusion plot did not pass through the origin, the model indicated that the adsorption mechanism was more than one mechanism and intra-particle diffusion was not the only rate-limiting step. Thus, it can be concluded that the mechanism of PhGs adsorption on CMK-3 was complex that both the external surface adsorption and intra-particle diffusion occurred simultaneously.
Repetitive Experiment
Reusability was an important factor in considering the use and value of adsorbents in practical applications. Therefore, the cyclic adsorption performance of CMK-3 for the crude extract was tested. Figure 10 shows the results of cyclic adsorption of CMK-3 for a crude extract of Cistanche tubulosa. It can be observed from Figure 10 that the adsorption capacity of CMK-3 changed from 358.09 ± 4.13 mg/g to 320.78 ± 5.62 mg/g after three cycles of adsorption, which indicated the CMK-3 had good repeatability, and CMK-3 can be repeatedly used to adsorb PhGs.
CONCLUSIONS
The adsorption properties of PhGs on the three kinds of mesoporous carbons were investigated and the mesoporous carbon before and after adsorption were characterized. The results showed that CMK-3 had the largest specific surface area and pore volume among the three adsorbents (CMK- 3, DMC, and CMK-8), and it can adsorb PhGs molecules more effectively than DMC and CMK-8 from the extracts of Cistanche tubulosa. Because the oxygen-containing functional groups on the surface of CMK-3 can provide a large number of active adsorption sites for the PhGs molecules. In addition, hydrogen bonds were formed between hydroxyl groups of PhGs and the oxygen-containing functional groups of CMK- 3. The adsorption capacity of crude extract for PhGs was 358.09 ± 4.13 mg/g at the optimal conditions of 0.41 mg/L, pH = 6 and 60◦C, and the corresponding desorption rate of CMK-3 was 95.02%. The adsorption data exhibited that adsorption of PhGs closely followed the Langmuir model and pseudo-second-order models, the intra-particle diffusion model suggested that the rate-limiting steps of adsorption were intra-particle diffusion model. The CMK-3 can be used as a potential adsorbent to highly efficient adsorb PhGs from Cistanche tubulosa.

NATURAL CISTANCHE TUBULOSA EXTRACT CISTANCHE HERB EXTRACT PHGS75% ECH 30% ACT 12%