Uric Acid Lowering Effect And Mechanism Of Acteoside And Echinacoside Extracted From Cistanche Tubulosa
Mar 03, 2025
Abstract: Aim To explore the uric acid lowering effects and mechanisms of acteoside (AS) and echinacoside (ECH) extracted from Cistanche tubulosa.
Methods Hyperuricemia (HUA) rat model was established using potassium oxonate (1.5 g·kg-1·d-1 ) combined with adenine (100 mg·kg-1·d-1 ). The HUA model rats were randomly divided into a model control group, an allopurinol group (30 mg·kg-1·d-1 ), AS low and high (50, 100 mg·kg-1·d-1 ) dose groups, and ECH low and high (50, 100 mg·kg-1·d-1 ) dose groups. A normal control group was previously established. After four weeks of administration, the blood biochemistry analyzer was used to detect SUA UREA, CREA, adenosine deaminase (ADA) and uric acid (UUA) levels in urine. Enzyme linked immunosorbent assay was used to detect xanthine oxidase (XOD) levels in serum. Kidney tissue was collected, and kidney coefficient was weighed and calculated. Hematoxylin eosin (HE) staining was used to observe renal pathological changes. Immunohistochemistry (IHC) and Real time PCR were used to detect the protein and mRNA expression levels of urate transporter 1 (URAT1), glucose transporter 9 (GLUT9), organic anion transporter 1 (OAT1), and organic anion transporter 3 (OAT3) in renal tissue. Results AS and ECH could improve renal function in HUA model rats, reduce blood uric acid levels, promote uric acid excretion, downregulate serum levels of ADA and XOD, and upregulate protein and mRNA expression of URAT1 and GLUT9 in renal tissue, while upregulating protein and mRNA expression of OAT1 and OAT3 in renal tissue.
Conclusions The phenylethanoid glycosides AS and ECH from Cistanche tubulosa may exert uric acid lowering effects by improving renal function in HUA model rats, reducing ADA and XOD levels, and regulating the expression of URAT1, GLUT9, OAT1, and OAT3.
Key words: Cistanche tubulosa; acteoside; echinacoside; hyperuricemia; reducing uric acid; mechanism

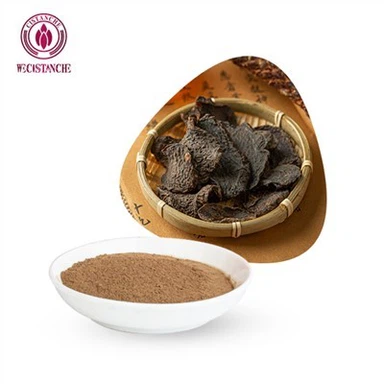
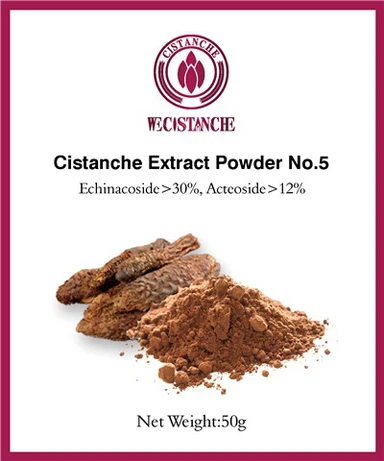
Cistanche Tubulosa Extract With 16% Acteoside
Hyperuricemia (HUA) is a metabolic disease caused by disordered purine metabolism in the human body, leading to elevated blood uric acid levels [1]. It is typically diagnosed when blood uric acid levels exceed 7.0 mg·dl⁻¹ (416.0 μmol·L⁻¹) in men and 6.0 mg·dl⁻¹ (357.0 μmol·L⁻¹) in women [2]. The development of hyperuricemia is primarily related to factors such as high-purine diets, chronic alcohol consumption, medication use, and hypothyroidism. It not only increases the risk of cardiovascular diseases, diabetes, and hypertension [3-4] but also significantly impacts the health of patients.

Currently, clinical treatments for hyperuricemia mainly include drugs that inhibit uric acid production and promote uric acid excretion. However, these treatments have certain limitations for patients with impaired liver or kidney function [5-6]. Therefore, exploring effective drugs with low side effects is of great significance for the prevention and treatment of hyperuricemia.
Cistanche tubulosa (Schenk) R. Wight, commonly used in traditional Chinese medicine as a kidney-tonifying herb, is employed to treat conditions such as impotence, infertility, deficiency of essence and blood, weakness in the lower back and knees, muscle weakness, and constipation due to intestinal dryness [7]. Studies have shown that Cistanche tubulosa possesses neuroprotective [8], anti-inflammatory [9], bone metabolism-regulating [10], and efficacy-enhancing effects in chemotherapy for cancer patients [11]. Among its various active components, phenylethanoid glycosides are the most abundant.
Acteoside (AS) and echinacoside (ECH), two phenylethanoid glycosides with high content in Cistanche tubulosa, exhibit strong biological activity and hold significant potential for development and application. Consequently, our research group selected AS and ECH for further study. Through network pharmacology predictions and pre-experiments in mice, we discovered that phenylethanoid glycoside extracts from Cistanche tubulosa may have a certain uric acid-lowering effect. However, the pathways and mechanisms of these effects remain unclear.
Thus, using the mechanisms of uric acid production and its primary excretion pathways as the research focus, we investigated the uric acid-lowering effects of the phenylethanoid glycoside extracts AS and ECH. This study aims to elucidate the pathways and mechanisms through which AS and ECH exert their uric acid-lowering effects.

1 Materials
1.1 Experimental Animals
Seventy male SPF-grade Sprague-Dawley (SD) rats, weighing 150–180 g, were purchased from the Experimental Animal Center of Xinjiang Medical University. Animal production license number: SCXK (Xin) 2023-0001. This experiment was approved by the Animal Ethics Committee of the Xinjiang Autonomous Region Uygur Medicine Research Institute, with the animal ethics approval number: IACUC-(Zhun)-2024-009.
1.2 Drugs and Reagents
Phenylethanoid glycoside extracts (AS and ECH) from Cistanche tubulosa (purity >98%, verified by high-performance liquid chromatography) were extracted, purified, and prepared by the Key Laboratory of Uygur Formulation Science, Xinjiang Autonomous Region Uygur Medicine Research Institute. Batch numbers: 20220617 (AS) and 20220526 (ECH).
Allopurinol tablets, batch number: 62208726, manufactured by Jiangsu Wanbang Biochemical Pharmaceutical Group Co., Ltd.
Potassium oxonate and adenine, batch numbers: I2130050 and C2202255, purchased from Shanghai Aladdin Biochemical Technology Co., Ltd.
CREA (creatinine), UA (uric acid), UREA, and ADA (adenosine deaminase) assay kits, batch numbers: 141123010, 141223004, 141323008, and 043624005, purchased from Shenzhen Mindray Bio-Medical Electronics Co., Ltd.
XOD (xanthine oxidase) activity assay kit, batch number: Y10001219, purchased from Shanghai Macklin Biochemical Technology Co., Ltd.
Antibodies (URAT1, GLUT9, OAT1, OAT3), batch numbers: 3i57230, 92f0296/4, 0f33081/2i44618, purchased from Affinity Biosciences.
HRP-labeled goat anti-rabbit IgG, batch number: 245440113, purchased from ZSGB-Bio.
Hematoxylin staining solution, batch number: 24135741H, purchased from Beijing Lanjieke Technology Co., Ltd.
DAB chromogenic reagent kit, batch number: 240010512, purchased from ZSGB-Bio.
DEPC (diethyl pyrocarbonate), catalog number: D60029-500 mL, purchased from Amresco (USA).
M5 HiClear DL2000 DNA marker, catalog number: MF025, purchased from Beijing Genomics Biotechnology Co., Ltd.
TRIzol™ Reagent, catalog number: 15596026, purchased from Thermo Fisher Scientific (USA).
5X All-In-One RT MasterMix and EvaGreen Express 2× qPCR MasterMix-Low Rox, catalog numbers: G492 and G891, both purchased from Applied Biological Materials Inc. (ABM).

2 Methods
2.1 Model Establishment and Grouping
Seventy male Sprague-Dawley (SD) rats were acclimated and divided into two groups: a normal control group (10 rats) and a model control group (60 rats). The normal control group was administered 0.5% CMC-Na via gavage. The model control group was administered potassium oxonate (1.5 g·kg⁻¹) combined with adenine (100 mg·kg⁻¹) at a dose of 10 mL·kg⁻¹, once daily for 14 consecutive days. The model was considered successfully established when UREA, CREA, and SUA levels significantly increased, as measured by a biochemical analyzer.
The hyperuricemia model rats were further divided into the following groups based on SUA, UREA, and CREA levels: model control group, allopurinol group (30 mg·kg⁻¹), low-dose AS group (50 mg·kg⁻¹), high-dose AS group (100 mg·kg⁻¹), low-dose ECH group (50 mg·kg⁻¹), and high-dose ECH group (100 mg·kg⁻¹), with 10 rats in each group. To maintain stable hyperuricemia, all groups except the normal control group were administered potassium oxonate (500 mg·kg⁻¹) combined with adenine (100 mg·kg⁻¹) via gavage in the morning, followed by administration of the respective drugs in each treatment group in the afternoon. The normal control group received 0.5% CMC-Na solution in the morning and drinking water in the afternoon at a dose of 10 mL·kg⁻¹, once daily for 14 consecutive days. Afterward, administration of modeling agents was stopped, and the respective drugs were continuously administered daily for an additional 14 days.
2.2 Sample Collection
After the final dose, the rats were fasted overnight (water was not restricted). Urine from each group was collected for uric acid testing. Body weight was measured after fasting, and blood samples were collected under anesthesia. Serum was separated by centrifugation and stored for future use. Kidney tissues were collected and weighed. One kidney was fixed in 4% paraformaldehyde solution, while the other was snap-frozen in liquid nitrogen for further analysis.
2.3 Measurement of Uric Acid in Rat Urine
Urine samples from each group were centrifuged (3,000 r·min⁻¹, 10 min, centrifuge radius 14 cm), and the supernatant was collected. Urine samples were diluted 1:9 with saline and analyzed for uric acid content using a biochemical analyzer.

2.4 Measurement of ADA, UREA, CREA, and SUA in Rat Serum
Blood samples from each group were centrifuged (3,000 r·min⁻¹, 10 min, centrifuge radius 14 cm), and serum was collected. ADA, UREA, CREA, and SUA levels in the serum were measured using a biochemical analyzer.
2.5 Measurement of XOD in Rat Serum
Changes in XOD levels in rat serum were measured using an enzymatic assay according to the manufacturer's instructions. The initial absorbance (A₁) and final absorbance (A₂) at 290 nm were recorded, and ΔA (ΔA = A₂ - A₁) was calculated. ΔA was substituted into the formula:
XOD (nmol⁻¹·min⁻¹·mL⁻¹) = [ΔA × reaction system total volume ÷ (molar extinction coefficient of uric acid × optical path length) × 10⁹] ÷ sample volume ÷ time = 4262 × ΔA,
to calculate the amount of uric acid catalyzed per minute per milliliter of serum.
2.6 Kidney Coefficient Measurement
Kidney tissues were collected, washed with saline, and excess water was removed. The organ weight was accurately measured, and the kidney coefficient was calculated as follows:
Kidney coefficient = kidney weight (mg) / body weight (g).
2.7 Histopathological Observation of Kidney Tissue by HE Staining
Kidney tissues fixed in 4% paraformaldehyde solution were dehydrated with graded ethanol concentrations, cleared with xylene, embedded in paraffin, and sectioned into 4-μm slices. The sections were deparaffinized with xylene, hydrated with graded ethanol, stained with hematoxylin and eosin (HE), and sealed with neutral gum. The morphological changes in kidney tissue were observed under a light microscope, and images were captured at 400× magnification.
2.8 Detection of URAT1, GLUT9, OAT1, and OAT3 Protein Expression in Kidney Tissue by IHC
Kidney tissues fixed in 4% paraformaldehyde solution were dehydrated with graded ethanol concentrations, cleared with xylene, embedded in paraffin, and sectioned. Antigen retrieval and goat serum blocking were performed. Primary antibodies (URAT1, GLUT9, OAT1, OAT3) were added at a 1:200 dilution and incubated overnight at 4 °C. The next day, the sections were washed with PBS, air-dried, and incubated with biotin-labeled goat anti-rabbit IgG at 37 °C for 30 minutes. The sections were washed with PBS and incubated with DAB chromogenic reagent for 10 minutes, followed by PBS rinsing, hematoxylin staining for 3 minutes, differentiation with hydrochloric acid ethanol solution, lithium carbonate blueing, dehydration with gradient ethanol, clearing with xylene, and sealing with neutral gum.
For each rat, two random 400× fields of kidney sections were selected. Positive staining (brown-yellow) was analyzed, and the integrated optical density (IOD) of each field was measured using Image-Pro Plus 6.0 for statistical analysis.