Effects Of Different Packaging Materials And Storage Conditions On The Shelf Life Of Cistanche Deserticola Dried Slices
Apr 03, 2026
Abstract
To address browning, active compound degradation, and the short shelf life observed during storage of dried Cistanche deserticola slices, this study evaluated the effects of different barrier packaging materials on vacuum-packaged samples: polyethylene terephthalate/aluminum/polyethylene laminated film (PET/Al/PE; abbreviated as Al), polyamide/polyethylene laminated film (PA/PE), ethylene–vinyl alcohol copolymer/polyamide laminated film (EVOH/PA, abbreviated as EVOH), and polyethylene film (PE). Unpackaged samples (CK) served as the control.
Storage trials were conducted at 4 °C and 25 °C. Changes in color, total flavonoid content, sensory scores, and microbial indicators were monitored to determine the optimal packaging method and appropriate storage temperature. Accelerated shelf-life testing (ASLT) combined with the Q10 model was applied to predict shelf life.
Results showed that mold growth on dried Cistanche deserticola slices was significantly slower at 25 °C than at 4 °C (p<0.05p < 0.05p<0.05). At the same storage temperature, preservation performance ranked as Al > EVOH > PA/PE > PE > CK, with vacuum-packed Al at 4 °C providing the best overall effect. Using a sensory score below 60 as the shelf-life endpoint, the Q10 model predicted shelf lives at 25 °C of 267, 264, 362, 335, and 335 days for CK, PE, Al, PA/PE, and EVOH, respectively. Relative errors between predicted and observed values were below 10%.
In conclusion, vacuum-packed Al stored at 4 °C was identified as the optimal storage condition for C. deserticola dried slices. Under 25 °C, the predicted shelf life of Al-packaged samples reached 362 days.
Keywords: Cistanche deserticola dried slices; barrier packaging materials; vacuum packaging; storage temperature; shelf life prediction; Q10 model; packaging materials and storage conditions on the shelf life of Cistanche plant extract
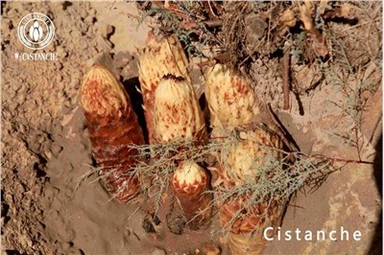
Cistanche tubulosa

1. Introduction (Background for R&D and Factory Owners)
Cistanche deserticola is a typical desert parasitic plant mainly distributed in the arid and semi-arid regions of Northwest China. Due to its pronounced tonic effects, it is often referred to as "desert ginseng" 111. Traditional Chinese medicine considers it beneficial for kidney tonification, essence replenishment, and bowel relaxation. Modern research further supports multiple physiological activities, including antioxidant, anti-inflammatory, immune-regulating, neuroprotective effects, and improvement of intestinal function 2,32,32,3.
Cistanche deserticola contains abundant bioactive components such as phenylethanoid glycosides (PhGs), polysaccharides, phenolic acids, and flavonoids. Among these, PhGs represented by echinacoside and acteoside (verbascoside) are listed in the Chinese Pharmacopoeia as marker compounds for quality evaluation and form the material basis for its functional activity 444. With inclusion in the "medicine and food homology" catalog, applications are expanding from traditional medicinal use to functional foods and health-food ingredients 5,65,65,6.
Dried-slice products are attractive for commercialization because of low moisture, convenient transport, and flexible consumption. However, during storage they easily undergo darkening/browning, flavor deterioration, active compound degradation, and moisture absorption/reversion-directly reducing sensory quality, nutritional value, and shelf-life stability.
Table 1. Linear relationship of five phenylethanoid glycosides
| Compound | Regression equation | R2R^2R2 | Linear range (µg/mL) |
|---|---|---|---|
| Echinacoside | Y=0.2326x−0.0041Y = 0.2326x - 0.0041Y=0.2326x−0.0041 | 1.0000 | 0.5–200 |
| Acteoside (Verbascoside) | Y=0.2990x+0.0006Y = 0.2990x + 0.0006Y=0.2990x+0.0006 | 0.9999 | 0.5–200 |
| Cistanoside A | Y=0.2369x−0.0048Y = 0.2369x - 0.0048Y=0.2369x−0.0048 | 1.0000 | 0.5–200 |
| Isoacteoside | Y=0.2514x−0.0130Y = 0.2514x - 0.0130Y=0.2514x−0.0130 | 0.9998 | 0.5–200 |
| 2′-Acetylacteoside | Y=0.2583x−0.0052Y = 0.2583x - 0.0052Y=0.2583x−0.0052 | 0.9999 | 0.5–200 |
Table 2. Sensory evaluation panel (scoring criteria)
| Item (Max score) | Scoring criteria | Score range |
|---|---|---|
| Color (30) | Uniform and consistent color, glossy | 22–30 |
| Slightly non-uniform color, some gloss | 15–21 | |
| Non-uniform color, no gloss | 0–14 | |
| Flavor (40) | Strong characteristic Cistanche flavor, no off-odor | 33–40 |
| Characteristic flavor present, no off-odor | 20–32 | |
| Weak characteristic flavor, slight off-odor | 0–19 | |
| Texture / tissue state (30) | Good plumpness, no breakage, no shrinkage, non-sticky | 22–30 |
| Moderate plumpness, slightly dry, slightly sticky | 15–21 | |
| Poor plumpness, obvious dryness, sticky | 0–14 |
Quality deterioration of dried plant foods is closely linked to oxygen, moisture, and light, making packaging material barrier properties (oxygen barrier, moisture barrier, light barrier) critical for shelf-life extension 777. High-barrier films effectively block oxygen and water vapor permeation and are therefore important in extending shelf life for foods and botanical products. Common films include: PE, PET/Al/PE aluminum foil laminated film (Al), PA/PE, and EVOH/PA (EVOH) 8,98,98,9. In general:
PE film: good moisture resistance and dust/water protection, but weak oxygen and light barrier.
Al foil laminates: extremely high gas barrier and light barrier; can maximally delay oxidation and browning.
PA/PE laminates: high mechanical strength, puncture resistance, and good heat-sealing; suitable for transportation and storage of dried goods.
EVOH laminates: excellent oxygen barrier under low-humidity conditions; also relatively transparent 999.
Previous research shows that high-barrier packaging combined with suitable storage conditions significantly slows quality degradation in dried plant foods. For jujube slices, aluminum foil composite films performed best in slowing browning and maintaining vitamin C, total phenols, and total flavonoids 101010. For dried garlic slices, aluminum foil composites combined with vacuum packaging better preserved allicin and ascorbic acid than PE or PA/PE during long storage 111111. For dried water-lily petals, low temperature plus vacuum packaging effectively controlled moisture increase and reduced losses of vitamin C and total phenols compared with room temperature or non-vacuum packaging 121212.
Cistanche tubulosa

Compared with common dried fruits and vegetables, Cistanche dried slices have special stability challenges. Their key bioactives-PhGs-contain phenolic hydroxyl groups highly sensitive to oxidation and light. Storage may involve complex changes including sugar conversion, Maillard reactions, and slow microbial growth 13,1413,1413,14. Systematic studies on packaging materials and storage temperature effects on bioactive stability, sensory quality, moisture state, and microbial safety are still limited, leaving insufficient scientific evidence to directly guide industrial packaging design and shelf-life prediction.
Therefore, this study selected packaging materials with different barrier performances (Al foil laminate, PA/PE, EVOH laminate, and PE) to package Cistanche dried slices under vacuum, compared with an unpackaged control (CK). Under different storage temperatures, changes in physicochemical properties, bioactive compounds, sensory quality, and microbial indicators were evaluated. High-temperature ASLT combined with a kinetic model was used to predict shelf life, clarifying the influence of packaging material and storage conditions on quality changes and shelf-life parameters.
2. Materials and Methods
2.1 Materials and Instruments
Cistanche deserticola was provided by an enterprise in Alxa. Reference standards-echinacoside (≥99%), acteoside/verbascoside (≥99%), cistanoside A (≥99%), isoacteoside (≥99%), and 2′-acetylacteoside (≥97%)-were purchased from Chengdu Pusi Biological Technology Co., Ltd. Rutin (≥99.0%), fructose (≥99.9%), glucose (≥98.6%), and sucrose (≥99.9%) were purchased from Shanghai Yuanye Bio-Technology.
Packaging films (from Hohhot Yuhesuye Co., Ltd.):
PE film: OTR 5126.0 cm³·m⁻²·d⁻¹; CO₂TR 18970.0 cm³·m⁻²·d⁻¹; WVTR 12.4 g·m⁻²·d⁻¹
Al (PET/Al/PE): OTR 0.01 cm³·m⁻²·d⁻¹; WVTR 0.01 g·m⁻²·d⁻¹
PA/PE: OTR 45.6 cm³·m⁻²·d⁻¹; CO₂TR 428.5 cm³·m⁻²·d⁻¹; WVTR 8.1 g·m⁻²·d⁻¹
EVOH/PA (EVOH): OTR 0.1 cm³·m⁻²·d⁻¹; CO₂TR 0.8 cm³·m⁻²·d⁻¹; WVTR 5.1 g·m⁻²·d⁻¹
Main instruments included constant temperature and humidity chambers (DHG-9053A), muffle furnace, water activity meter (HD-5), pH meter (PHS-3C), Kjeldahl analyzer (K1100), UV–Vis spectrophotometer (TU-1810), centrifuge (H1850R), HPLC (Thermo Ultimate 3000), analytical balance, and biochemical incubator.
Table 3. Changes of color stability of Cistanche dried slices stored at 4 °C
| Storage time (d) | CK | PE | Al | PA/PE | EVOH |
|---|---|---|---|---|---|
| 0 | 49.92 ± 3.66Aa | 49.92 ± 3.66Aa | 49.92 ± 3.66Aa | 49.92 ± 3.66Aa | 49.92 ± 3.66Aa |
| 56 | 42.99 ± 2.21Ab | 43.33 ± 3.52Ab | 45.73 ± 4.60Aa | 44.70 ± 2.44Aab | 44.40 ± 4.23Abc |
| 112 | 38.74 ± 6.98Bc | 43.74 ± 3.46Ab | 48.23 ± 3.63Aa | 46.90 ± 5.84Aa | 45.31 ± 1.89Aab |
| 168 | 39.14 ± 4.64Bc | 42.95 ± 5.94Cb | 48.56 ± 6.16Aa | 47.14 ± 5.76Aa | 40.68 ± 3.39Ccd |
| 224 | 35.41 ± 5.32Bc | 40.14 ± 2.58Bb | 47.26 ± 8.47Aa | 47.91 ± 4.47Aa | 38.05 ± 5.54Bd |
| 280 | 29.04 ± 1.75Cd | 39.18 ± 4.89Bb | 45.36 ± 2.06Aa | 40.37 ± 6.64ABbc | 41.36 ± 8.32ABbcd |
| 336 | 26.88 ± 3.27Dd | 32.44 ± 6.43Cc | 44.01 ± 7.18Aa | 36.07 ± 5.44BCc | 39.47 ± 4.86ABcd |
a*
| Storage time (d) | CK | PE | Al | PA/PE | EVOH |
|---|---|---|---|---|---|
| 0 | 8.95 ± 1.40Aa | 8.95 ± 1.40Aa | 8.95 ± 1.40Aa | 8.95 ± 1.40Aa | 8.95 ± 1.40Aa |
| 56 | 5.31 ± 0.68Bb | 6.76 ± 1.06Acd | 6.81 ± 0.53Abc | 5.80 ± 0.72ABbc | 5.20 ± 1.93Bc |
| 112 | 5.18 ± 0.82Bb | 7.94 ± 0.78Abc | 7.56 ± 1.83Aab | 4.82 ± 1.32Bc | 5.97 ± 1.35Bbc |
| 168 | 4.60 ± 1.31Bc | 4.66 ± 2.65Bc | 7.69 ± 2.37Aab | 6.76 ± 2.58ABb | 6.50 ± 2.76ABbc |
| 224 | 5.26 ± 2.10Ab | 5.65 ± 1.54Ade | 5.83 ± 3.53Abc | 4.71 ± 1.65Ac | 6.47 ± 1.84Abc |
| 280 | 3.72 ± 0.91Cc | 4.21 ± 0.28Cde | 5.52 ± 1.34Bc | 6.11 ± 1.82Bbc | 7.62 ± 0.94Aab |
| 336 | 4.10 ± 1.03Cbc | 5.65 ± 1.85Bde | 6.77 ± 1.18Aab | 6.81 ± 1.21AAb | 6.31 ± 1.35Bbc |
b*
| Storage time (d) | CK | PE | Al | PA/PE | EVOH |
|---|---|---|---|---|---|
| 0 | 24.26 ± 1.70Aa | 24.26 ± 1.70Aa | 24.26 ± 1.70Aa | 24.26 ± 1.70Aa | 24.26 ± 1.70Aa |
| 56 | 20.04 ± 2.43Ab | 20.88 ± 2.84Aab | 19.41 ± 3.25Abc | 19.95 ± 1.85Abcd | 15.78 ± 4.31Bcd |
| 112 | 15.39 ± 4.44Cc | 19.27 ± 3.35Bbc | 26.00 ± 5.18Aa | 19.36 ± 2.03BCcd | 22.47 ± 4.41ABab |
| 168 | 15.59 ± 2.00Bc | 16.84 ± 3.61Bc | 25.02 ± 5.89Aa | 23.45 ± 5.67Aab | 16.62 ± 1.95Bcd |
| 224 | 13.56 ± 3.01Bc | 15.83 ± 1.78Bc | 21.42 ± 4.19Aab | 20.92 ± 3.47Aabc | 14.03 ± 3.51Bd |
| 280 | 6.06 ± 1.57Cd | 23.24 ± 4.66Aa | 15.84 ± 5.99Bc | 16.67 ± 4.14Bde | 18.96 ± 5.63ABbc |
| 336 | 6.52 ± 2.56Cd | 11.78 ± 6.18Bd | 22.52 ± 4.56Aab | 15.11 ± 5.02Bc | 16.28 ± 3.51Bcd |
2.2 Experimental Design
2.2.1 Sample Preparation
Fresh Cistanche was sliced and portioned at 10 g per bag. Al, PA/PE, EVOH, and PE bags were used for vacuum packaging. An unpackaged control group (CK) was also set.

Fig 1 Changes in total flavonoid content of Cistanche dried slices during storage

Fig.2 Changes in moisture content and water activity of Cistanche dried slices during storage

Fig.3 Changes in pH and acidity of Cistanche dried slices during storage
2.2.2 Storage Conditions
Packaged samples and CK samples were stored in constant temperature and humidity chambers at:
4 °C (50%–55% RH)
25 °C (40%–50% RH)
Sampling was performed at 0, 56, 112, 168, 224, 280, and 336 days. After opening packages, physicochemical indices, sensory properties, PhGs content, and mold count were measured.
Cistanche tubulosa

2.3 Analytical Methods
2.3.1 Color Measurement
Color was measured using a colorimeter, recorded as L*, a*, b*. L* reflects brightness, a* reflects redness, and b* reflects yellowness. Three slices per group were randomly selected, each tested at multiple points three times.
2.3.2 Total Flavonoids Determination
A rutin standard curve was prepared following Xiarepati·Tusun et al. 151515. Absorbance at 510 nm was measured. The standard curve was:
Y=1.09959x−0.0034, R2=0.9999Y = 1.09959x - 0.0034,\; R^2 = 0.9999Y=1.09959x−0.0034,R2=0.9999.
Extraction was modified from Zou Guihua 161616. Appropriate dried slices were weighed into a 50 mL volumetric flask, extracted twice with 70% ethanol under ultrasound (30 min each), combined, cooled, made up to volume with 70% ethanol, shaken, and filtered.
Absorbance was measured at 510 nm; concentration CCC was calculated from the standard curve, and total flavonoid yield was calculated using Equation (1):
Total flavonoid yield (%)=(C×N×Vw)×100(1)\text{Total flavonoid yield (\%)} = \left(\frac{C \times N \times V}{w}\right)\times 100 \tag{1}Total flavonoid yield (%)=(wC×N×V)×100(1)
Where:
CCC = concentration of total flavonoids in sample solution (mg/mL);
VVV = dilution volume (mL);
NNN = dilution factor;
www = sample mass (g).
(You already generated a clean equation image for (1); it can be inserted here.)
2.3.3 Total Sugars Determination
HPLC separation with refractive index detection; external standard quantification. Method referenced GB 5009.8-2023 171717, with slight adjustment to sample pretreatment. Sample was dissolved in 40% acetonitrile, treated with zinc acetate and potassium ferrocyanide as precipitants, ultrasonicated, cooled, made up to volume, centrifuged, filtered through a 0.45 μm organic membrane, and analyzed in triplicate.
2.3.4 Moisture Content and Water Activity (Aw)
Moisture content: direct drying method, GB 5009.3-2016 181818.
Water activity: GB 5009.238-2016 191919.
Triplicate measurements.
2.3.5 Acidity
Titration method per GB 12456-2021 202020, in triplicate.
2.3.6 Phenylethanoid Glycosides (PhGs) by HPLC
Standard solutions: echinacoside, acteoside, cistanoside A, isoacteoside, 2′-acetylacteoside prepared at 1 mg/mL in 50% methanol, then gradient dilutions were made. Calibration curves were established (Table 1).
Sample solution: modified from Liu Bonan et al. 212121. Powdered sample (60 mesh) was extracted with 50% methanol in the dark (soaking 30 min + ultrasound 40 min), mass compensated after cooling, centrifuged, filtered through 0.22 μm membrane.
HPLC conditions: Ultimate XB-C18 (250 mm × 4.6 mm, 5 μm); mobile phase 0.1% formic acid water (A)–methanol (B) with gradient elution 222222; detection at 330 nm; column temperature 35 °C; injection 10 μL; flow 1.0 mL/min.
2.3.7 Microbiological Indicators
Aerobic plate count: GB 4789.2-2022 232323
Molds/yeasts: GB 4789.15-2016 242424
E. coli: GB 4789.38-2025 252525
Triplicate.
2.3.8 Sensory Evaluation
A trained panel of 15 students conducted sensory evaluation. Color, flavor, and texture/state were scored independently 262626. Total score was reported as mean ± SD (Table 2).
Table 11. Shelf life of dried Cistanche slices at 45 °C and 55 °C (ASLT)
| Packaging | Shelf life at 45 °C (d) | Shelf life at 55 °C (d) | Q10Q_{10}Q10 |
|---|---|---|---|
| CK | 58.22 | 27.21 | 2.14 |
| PE | 62.19 | 30.23 | 2.06 |
| Al | 78.35 | 36.41 | 2.15 |
| PA/PE | 73.08 | 34.22 | 2.14 |
| EVOH | 74.56 | 35.18 | 2.12 |
Table 12. Predicted and actual shelf life of dried Cistanche slices at 25 °C
| Packaging | Predicted value (d) | Actual value (d) | Relative error (%) |
|---|---|---|---|
| CK | 267 | 280 | 4.64 |
| PE | 264 | 280 | 5.71 |
| Al | 362 | 336 | 7.74 |
| PA/PE | 335 | 336 | 0.30 |
| EVOH | 335 | 336 | 0.30 |
3. Accelerated Shelf-Life Testing (ASLT)
3.1 High-Temperature Storage for ASLT
Based on dried-food ASLT temperature-setting principles 212121, vacuum-packaged samples were stored at 45 °C and 55 °C. Sampling followed the test cycle until shelf-life endpoint (sensory score < 60). Two temperatures plus Q10 model were used to predict shelf life at 25 °C.
3.2 Q10 Model and Shelf-Life Calculation
Q10 was calculated using Equation (2). Q10 was preset to 2 considering dried fruit/vegetable characteristics; sampling intervals were calculated accordingly: 45 °C every 14 days, 55 °C every 7 days.
Q2=Q1×Q10ΔT/10(2)Q_2 = Q_1 \times Q_{10}^{\Delta T/10} \tag{2}Q2=Q1×Q10ΔT/10(2)
Where:
Q1Q_1Q1 = testing interval at higher temperature T1T_1T1 (days);
Q2Q_2Q2 = testing interval at lower temperature T2T_2T2 (days);
ΔT=T1−T2\Delta T = T_1 - T_2ΔT=T1−T2, T1>T2T_1 > T_2T1>T2.
Shelf life at a target temperature was calculated by Equation (3):
SLs(T1)=SLs(T2)×Q10ΔT/10(3)SL_s(T_1) = SL_s(T_2)\times Q_{10}^{\Delta T/10} \tag{3}SLs(T1)=SLs(T2)×Q10ΔT/10(3)
Where:
SLs(T1)SL_s(T_1)SLs(T1) = shelf life at expected temperature T1T_1T1;
SLs(T2)SL_s(T_2)SLs(T2) = shelf life at experimental temperature T2T_2T2;
ΔT=T1−T2\Delta T = T_1 - T_2ΔT=T1−T2.
(You provided equation images for (2) and (3); they can be inserted here.)
3.3 Linear Fitting of Sensory Score vs Time
Following Peng Dengshui et al. 272727, sensory score YYY and storage time xxx were linearly fitted:
Y=kx+bY = kx + bY=kx+b.
Fit quality was high at both 45 °C and 55 °C. With sensory score 60 as the critical endpoint, theoretical shelf life at each condition was calculated and used to compute Q10. Shelf life at 25 °C was predicted and compared with long-term storage data.
4. Data Processing
Microsoft Excel 2021 was used for data arrangement and preliminary calculations. SPSS Statistics 27 was used for statistical analysis (descriptive statistics, ANOVA, significance testing, P<0.05P < 0.05P<0.05). Origin 2025 was used for scientific plotting.
5. Results and Discussion (Key Findings for Commercial Use)
5.1 Overall Impact of Packaging Materials and Storage Conditions on Quality
5.1.1 Color Change (Browning) During Storage
Color parameters are critical indicators of appearance and browning 282828. Under both 4 °C and 25 °C, L*, a*, and b* values decreased with storage time (P<0.05P < 0.05P<0.05), indicating reduced brightness and a shift from light yellow toward dark brown.
At 4 °C, Al packaging best preserved color: at 336 days, L* and a* decreased by only 5.91 and 1.28 compared to day 0, while CK showed the largest reductions (23.04 and 4.85; P<0.05P < 0.05P<0.05). b* followed a similar trend; Al still maintained 22.52 at 336 days, whereas CK dropped to 6.52 (P<0.05P < 0.05P<0.05).
At 25 °C, declines accelerated. At 336 days, CK decreased in L* by 24.64 and in a* by 6.08, whereas Al declined less (L* −17.98; a* −2.75).
Mechanistically, color change is mainly linked to oxidation of phenolic substances. Oxygen, light, and temperature are key accelerators 282828. Low temperature slows reaction rates; high oxygen/light barriers reduce oxidative browning. Across both temperatures, Al film performed best; PA/PE and EVOH provided partial protection; PE and CK showed the most severe browning. Overall, Al + 4 °C is a strong practical choice when product appearance drives marketability.
5.1.2 Total Flavonoids Stability
Flavonoids contribute major antioxidant activity but are sensitive to oxygen and light and thus prone to oxidative degradation 292929. Total flavonoids decreased continuously in all groups with storage time, matching the trend of color deterioration.
Losses were greater at 25 °C than at 4 °C, indicating temperature accelerates degradation-consistent with prior findings that low temperature stabilizes flavonoids 303030. At 336 days, protection ranked:
Al > PA/PE > EVOH > PE > CK.
CK and PE had the greatest decline. Al provided the strongest protection (P<0.05P < 0.05P<0.05), supporting the use of high-barrier, light-shielding films for plant extract shelf life and botanical ingredient stability.
5.1.3 Total Sugars
Total sugars first increased significantly (P<0.05P < 0.05P<0.05) then gradually decreased at both temperatures. Early increases may be due to partial hydrolysis of polysaccharides by endogenous enzymes or microbes, generating soluble sugars. Later decreases may result from reducing sugars entering Maillard reactions and microbial utilization 303030.
Changes were more pronounced at 25 °C than 4 °C, suggesting low temperature slows conversion and consumption 323232. In 25 °C storage, CK peaked earlier (56 days), while Al/PA/PE/EVOH peaks were delayed to 168 days-implying barrier packaging slows metabolic/chemical progression. At late storage, CK and PE had the greatest decrease; Al retained sugars best.
5.1.4 Moisture Content, Aw, pH, and Acidity
Moisture and Aw are core variables controlling microbial stability and texture in dried products 282828. In early storage (0–56 days) at 4 °C, moisture decreased in all groups (P<0.05P < 0.05P<0.05); CK decreased most (8.9%), PA/PE least (1.6%). At 25 °C, decreases at 56 days were greater (CK 10.9%, PA/PE 6.3%), indicating faster water migration at higher temperature.
Aw behaved similarly: significant decreases up to 112 days (P<0.05P < 0.05P<0.05), then a continuous increase from 112–336 days. This may be due to internal water redistribution early, then later hydrolysis of macromolecules (proteins/polysaccharides) producing more hydrophilic small molecules that bind water, driving Aw up 282828. Fluctuations were larger at 25 °C than 4 °C. PA/PE helped reduce water migration; CK varied most.
pH decreased and acidity increased in all groups (P<0.05P < 0.05P<0.05), consistent with accumulation of acidic substances during storage and with Alagöz et al. 323232. Changes were stronger at 25 °C than 4 °C. Higher temperature may accelerate microbial metabolism and non-enzymatic reactions (including Maillard-related pathways), and degrade sugars/organics into small organic acids, lowering pH 34–3534–3534–35.
Packaging effects differed: EVOH and PA/PE showed smaller pH fluctuations, likely due to lower oxygen transmission, reducing oxidation and microbial activity. In acidity changes, temperature strongly modulated the packaging effect; under higher temperature, high-barrier packaging better suppressed acidity rise.
5.1.5 Stability of Phenylethanoid Glycosides (Key Actives)
PhGs are the major bioactive compounds and directly determine product quality. Both packaging and temperature significantly influenced PhGs content (P<0.05P < 0.05P<0.05).
Across both temperatures, echinacoside increased significantly during 0–56 days then fluctuated; at 336 days, CK and PE declined while PA/PE, EVOH, and Al remained slightly above the initial value of 0.225 g/100 g. Acteoside decreased initially then increased; at 336 days, PA/PE and EVOH were higher while CK was lowest. Cistanoside A increased early and remained above its initial value (0.027 g/100 g). Isoacteoside was stable at 4 °C but fluctuated more at 25 °C; 2′-acetylacteoside fluctuated and later decreased.
These results indicate that higher temperature accelerates degradation via increased molecular motion, oxidation rate, and microbial activity; low temperature suppresses these reactions 333333.
According to the Chinese Pharmacopoeia (2020), the combined content of echinacoside + acteoside should be ≥0.3%. At end storage, CK and PE fell below 0.3%, while Al/PA/PE/EVOH maintained ≥0.3% at both temperatures, with EVOH highest (P<0.05P < 0.05P<0.05). This highlights that high-barrier films effectively reduce oxygen and moisture impacts on PhGs stability.
5.1.6 Microbial Changes (Safety-Relevant)
Microbial contamination is crucial for dried product safety 343434. E. coli was not detected across storage, indicating good initial hygiene. Aerobic plate count started at 2.40 lg(CFU/g) and increased over time. Molds were initially not detected but appeared later, increasing faster at higher temperature.
CK first showed mold at 224 days (4 °C) and 168 days (25 °C). At 336 days, mold counts reached 1.91 lg(CFU/g) (4 °C) and 2.13 lg(CFU/g) (25 °C). Early slow growth may relate to decreasing moisture and Aw; low Aw restricts enzyme activity and mass transfer in microbes 343434. Later, when moisture/Aw rose, microbial growth accelerated and quality declined.
Using DBS35/001-2017 as reference, APC should be <5 lg(CFU/g) and mold <1.70 lg(CFU/g). At 280 days, CK and PE exceeded mold limits; Al/PA/PE/EVOH exceeded mold limits at 336 days, and 25 °C was worse than 4 °C. High-barrier packaging slows oxygen/water vapor migration and delays Aw rebound; low temperature further suppresses microbial metabolism.
5.1.7 Sensory Evaluation (Practical Shelf-Life Endpoint)
Appearance is a key commercial quality attribute 353535. During storage, slices darkened, became unevenly discolored, lost characteristic odor, and became shriveled. Under both temperatures, scores for color, flavor, and texture decreased significantly with time (P<0.05P < 0.05P<0.05). At 336 days, CK and PE were lowest.
Al was slightly better overall: at 336 days, total sensory scores remained 65 (4 °C) and 62 (25 °C)-higher than CK and PE. At 25 °C, sensory decline was faster due to accelerated oxidation and Maillard reactions, flavor loss, water migration, and texture collapse. Because Al film has extremely low OTR and WVTR and strong light barrier, it most effectively reduces oxidation and quality loss 353535.
5.2 ASLT and Shelf-Life Prediction (Q10 Model)
5.2.1 Key Changes Under Accelerated Conditions
ASLT was performed at 45 °C and 55 °C. Since these temperatures exceed typical optimal mold growth (~28 °C), microbial-driven changes cannot be accurately simulated; therefore, sensory score <60 was used as the main endpoint. Sensory results aligned with chemical deterioration trends. At 45 °C and 55 °C, CK and PE dropped below 60 at 70 days and 35 days, while Al/PA/PE/EVOH extended to 84 days and 42 days, mainly preserving odor and slowing browning and appearance degradation.
5.2.2 Predicted Shelf Life at 25 °C
At 45 °C: CK 58.2 d, PE 62.2 d; Al/PA/PE/EVOH extended to ~73–78 d.
At 55 °C: high-barrier groups were 34–36 d, longer than CK (27.2 d) and PE (30.2 d). Q10 values ranged 2.06–2.15.
By Q10 extrapolation, predicted shelf life at 25 °C was:
CK: 267 d
PE: 264 d
Al: 362 d
PA/PE: 335 d
EVOH: 335 d
Compared with long-term measured values (280, 280, 336, 336, 336 days), relative errors were <8%, showing good model reliability.
6. Conclusions
This study systematically evaluated the impact of packaging materials and storage conditions on the shelf life of Cistanche plant extract products (represented here by dried slices). Across quality indicators-color, total flavonoids, sugars, moisture/Aw, acidity, key PhGs, microbial safety, and sensory acceptance-low temperature storage significantly slowed browning and bioactive degradation and helped stabilize quality.
Among packaging options, Al and EVOH high-barrier films performed best overall. CK and PE showed significant deterioration at 25 °C. Microbial results indicated that low temperature plus high-barrier packaging inhibited microbial growth. Shelf-life prediction based on sensory scoring and Q10 modeling estimated shelf lives at 25 °C of 267 d (CK), 264 d (PE), 362 d (Al), 335 d (PA/PE), and 335 d (EVOH), with <10% prediction error.
Best recommended industrial condition: vacuum-packed Al (PET/Al/PE) stored at 4 °C.
If cold chain is not feasible: at 25 °C, Al packaging can still reach a predicted shelf life of ~362 days, making it a strong candidate for commercial distribution.
References
[1] 胡玉洁, 何张旭. 丹玉通脉颗粒对多柔比星所致小鼠心肌损伤的影响[J]. 新乡医学院学报, 2025, 42(12): 971-976, 982.
Hu Y J, He Z X. Effects of Danyu Tongmai Granules on doxorubicin-induced myocardial injury in mice[J]. Journal of Xinxiang Medical University, 2025, 42(12): 971-976, 982.
[2] Meng-Qi Z, Xia R, Qing Z, et al. Hepatoprotective effects of total phenylethanoid glycosides from Acanthus ilicifolius L. against carbon tetrachloride-induced hepatotoxicity[J]. Journal of Ethnopharmacology, 2020, 256: 112795.
[3] 闫文杰, 冯朵, 张绍时, 等. 基于网络药理学与动物实验探究肉苁蓉总苷对炎症性肠病的作用机制[J]. 中国食品学报, 2023, 23(10): 1-11.
Yan W J, Feng D, Zhang S S, et al. Mechanism of total glycosides from Cistanche deserticola in inflammatory bowel disease based on network pharmacology and animal experiments[J]. Chinese Journal of Food Science, 2023, 23(10): 1-11.
[4] Lian J, Zhu Y, Hu Q, et al. Impact of rice wine-steamed Cistanche deserticola polysaccharides on intestinal flora and immunological modulation in immunosuppressive mice induced by cyclophosphamide[J]. Frontiers in Immunology, 2026, 17: 1732818.
[5] 张珺, 李洋, 姜晓仙, 等. 肉苁蓉产品研究现状及发展前景[J]. 农产品加工, 2025: 1-6.
Zhang J, Li Y, Jiang X X, et al. Research status and development prospects of Cistanche deserticola products[J]. Agricultural Products Processing, 2025: 1-6.
[6] 刘朗, 张珍, 李蔚, 等. 喷雾与真空冷冻干燥方法对肉苁蓉红枣复合固体饮料品质的影响[J]. 食品与发酵工业, 2025, 51(1): 259-265.
Qiao M, Zhu Y, Hu J P, Yang J H. Prediction and validation of the mechanism of Cistanche deserticola in the treatment of inflammatory bowel disease[J]. China Pharmacy, 2024, 35(21): 2582-2589.
[7] 陈晓宇, 朱志强, 张小栓, 等. 食品货架期预测研究进展与趋势[J]. 农业机械学报, 2015, 46(8): 192-199.
Chen X Y, Zhu Z Q, Zhang X S, et al. Research progress and trends in food shelf-life prediction[J]. Transactions of the Chinese Society for Agricultural Machinery, 2015, 46(8): 192-199.
[8] 况慧, 蒋依伶, 康峰, 等. 食药同源肉苁蓉成分活性研究及产业现状[J]. 中国食品学报, 2025: 1-11.
Kuang H, Jiang Y L, Kang F, et al. Bioactive components and industrial status of medicinal and edible Cistanche deserticola[J]. Chinese Journal of Food Science, 2025: 1-11.
[9] 姜金星, 钟月妍, 黄红梅, 等. 不同干燥方式对金柑干制品的影响与评价[J]. 食品科技, 2025, 50(5): 105-111.
Jiang J X, Zhong Y Y, Huang H M, et al. Effects and evaluation of different drying methods on dried kumquat products[J]. Food Science and Technology, 2025, 50(5): 105-111.
[10] 邬明杰. 不同干燥方式,包装材料及温度对枣片贮藏品质的影响[D]. 南京: 南京农业大学, 2021.
Wu M J. Effects of different drying methods, packaging materials, and temperatures on the storage quality of jujube slices[D]. Nanjing: Nanjing Agricultural University, 2021.
[11] 郭利琴. 蒜片真空冷冻干燥工艺及其贮藏包装的研究[D]. 太原: 山西农业大学, 2020.
Guo L Q. Study on vacuum freeze-drying process and storage packaging of garlic slices[D]. Taiyuan: Shanxi Agricultural University, 2020.
[12] 邢佳文. 睡莲花瓣干燥工艺及其干制品贮藏稳定性研究[D]. 南京: 南京农业大学, 2020.
Xing J W. Drying process and storage stability of dried water lily petals[D]. Nanjing: Nanjing Agricultural University, 2020.
[13] 孙小涵. 食品包装材料对食品安全的影响[J]. 中国品牌与防伪, 2025(15): 17-19.
Sun X H. Effects of food packaging materials on food safety[J]. China Brand and Anti-counterfeiting, 2025(15): 17-19.
[14] 魏嘉雯, 姚博伟. 食品包装用PET材料检测标准化问题及其发展对策[J]. 食品安全导刊, 2025, 19(30): 164-166.
Wei J W, Yao B W. Standardization issues and development strategies for PET materials used in food packaging[J]. Food Safety Guide, 2025, 19(30): 164-166.
[15] 夏热帕提·吐孙, 艾来提·苏里坦, 买吾兰江, 等. 肉苁蓉总黄酮含量的测定[J]. 生物技术, 2008(4): 52-54.
Xiarepati T, Ailaiti S, Maiwulanjiang, et al. Determination of total flavonoid content in Cistanche deserticola[J]. Biotechnology, 2008(4): 52-54.
[16] 邹桂华, 宋伟东, 那志敏, 等. 青叶胆总黄酮提取及含量测定[J]. 中国中医药现代远程教育, 2023, 21(10): 135-137.
Zou G H, Song W D, Na Z M, et al. Extraction and determination of total flavonoids from Gentiana macrophylla[J]. Modern Distance Education of Chinese Medicine, 2023, 21(10): 135-137.
[17] 食品安全国家标准. 食品中果糖,葡萄糖,蔗糖,麦芽糖,乳糖的测定[S]. 北京: 国家卫生健康委员会, 国家市场监督管理总局, 2023.
[18] 食品安全国家标准. 食品中水分的测定[S]. 北京: 国家卫生和计划生育委员会, 2016.
[19] 食品安全国家标准. 食品水分活度的测定[S]. 北京: 国家卫生和计划生育委员会, 2016.
[20] 食品安全国家标准. 食品中总酸的测定[S]. 北京: 国家卫生健康委员会, 国家市场监督管理总局, 2021.
[21] 刘博男, 史辑, 张超, 等. 肉苁蓉不同干燥处理方式对成分含量的影响[J]. 中药材, 2020, 43(10): 2414-2418.
Liu B N, Shi J, Zhang C, et al. Effects of different drying treatments on component contents of Cistanche deserticola[J]. Chinese Herbal Medicines, 2020, 43(10): 2414-2418.
[22] 张超, 华悦, 廉婧, 等. 肉苁蓉炮制过程中苯乙醇苷类成分含量变化规律研究[J]. 中国中医药信息杂志, 2022, 29(4): 92-97.
Zhang C, Hua Y, Lian J, et al. Changes in phenylethanoid glycoside contents during processing of Cistanche deserticola[J]. Chinese Journal of Chinese Medicinal Information, 2022, 29(4): 92-97.
[23] 食品安全国家标准. 食品微生物学检验 菌落总数测定[S]. 北京: 国家卫生健康委员会, 国家市场监督管理总局, 2022.
[24] 食品安全国家标准. 食品微生物学检验 霉菌和酵母计数[S]. 北京: 国家卫生和计划生育委员会, 2016.
[25] 食品安全国家标准. 食品微生物学检验 大肠埃希氏菌计数[S]. 北京: 国家卫生健康委员会, 国家市场监督管理总局, 2025.
[26] 姚隆洋. 芒果干燥过程品质变化及贮藏稳定性研究[D]. 无锡: 江南大学, 2020.
[27] 彭灯水, 闵锡祥, 王文建, 等. 不同包装材质对泡菜脆口萝卜产品货架期的影响[J]. 中国调味品, 2018, 43(12): 142-145.
[28] Zheng Y, Liu G, Wang D, et al. Ultrasonic extraction, metabolomic analysis and antioxidant activities of phenylethanoid glycosides in Cistanche deserticola[J]. Journal of Applied Research on Medicinal and Aromatic Plants, 2026, 51: 100698.
[29] 高静静, 李佳, 玛尔哈巴·帕尔哈提, 等. 不同包装方式与贮藏条件对哈密瓜干品质的影响[J]. 食品科技, 2019, 44(3): 39-45.
[30] 朱文慧, 车凤斌, 郑素慧, 等. 不同贮藏条件对无核白葡萄干贮期功能性成分的影响[J]. 新疆农业科学, 2016, 53(8): 1429-1435.
[31] 龙凌云, 谢朝敏, 毛立彦, 等. 不同贮藏温度对甘薯块根内色泽和糖类成分含量变化的影响[J]. 热带作物学报, 2025, 46(6): 1461-1471.
[32] Alagöz S, Türkyılmaz M, Tağı Ş, Özkan M. Effects of different sorbic acid and moisture levels on chemical and microbial qualities of sun-dried apricots during storage[J]. Food Chemistry, 2015, 174: 356-364.
[33] Lian J, Min R, Dong K, et al. Polysaccharides from Cistanche deserticola: A comparative study of the impacts of the extraction methods on yield, structure, physicochemical properties, antioxidant, and hypolipidemic activities[J]. Food and Bioprocess Technology, 2026, 19(3): 114-.
[34] 张帆. 食品微生物污染源与传播途径研究[J]. 中国食品, 2024(10): 85-87.
[35] 王炳奎, 张猛超, 刘超纲, 等. 辐照灭菌对红薯干品质和贮藏特性的影响[J]. 核农学报, 2023, 37(3): 513-521.