Comparison Of Content Differences Of Eight Chemical Components in Raw And Wine-Processed Products Of Two Kinds Of Cistanche Deserticola Based On UPLC Ⅱ
Jun 16, 2025
2. Methods and Results
2.1 Chromatographic Conditions
UPLC analysis was performed using a Waters ACQUITY UPLC™ BEH C18 column (100 mm × 2.1 mm, 1.7 μm particle size). The mobile phase consisted of methanol (A) and 0.1% formic acid aqueous solution (B) with the following gradient elution:
0–4 min: 10% → 26% A
4–18 min: 26% → 40% A
18–20 min: 40% → 50% A
Flow rate: 0.3 mL/min
Injection volume: 3 μL
Column temperature: 35°C
Detection wavelength: 330 nm
2.2 Preparation of Solutions
2.2.1 Mixed Reference Solution
Accurately weigh the following standard compounds: cistanoside F, echinacoside, cistanoside A, verbascoside, tubuloside A, isoverbascoside, 2'-acetylverbascoside, and tubuloside B. Dissolve in 50% methanol to prepare a reference mixture with the following concentrations (µg·mL⁻¹):
Cistanoside F: 32.7
Echinacoside: 102.4
Cistanoside A: 50.2
Verbascoside: 80.6
Tubuloside A: 25.6
Isoverbascoside: 86.3
2'-Acetylverbascoside: 77.3
Tubuloside B: 60.8
2.2.2 Sample Solution
Raw Cistanche slices were prepared by softening the herb, slicing, and drying.
Wine-steamed Cistanche was prepared by soaking raw slices in 30% rice wine, steaming the mixture for 12 hours, cooling, and drying again.
Approximately 0.2 g of dried powder (passed through a 65-mesh sieve) was weighed into a 50 mL amber volumetric flask, extracted with 25 mL of 50% methanol, sonicated for 40 minutes (250 W, 35 kHz), and brought back to weight. The solution was filtered through a 0.22 μm membrane, and the filtrate was used for analysis.

Note: H. Desert Cistanche; G. Tubulosa Cistanche; RH. Cistanche deserticola raw slices; RG. Cistanche tubulosa raw slices; WH. Cistanche deserticola stewed with wine; WG. Cistanche tubulosa stewed with wine; Figures 4 to 7 are the same.
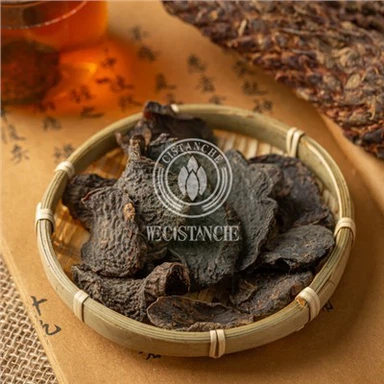
Figure 1 Pictures of Cistanche deserticola and Cistanche tubulosa medicinal materials, raw slices, and stewed with wine

a famous cistanche wine sold in China
Supportive Service Of Wecistanche-The Contact Us To Get A sample Or Wholesale Details
Email:wallence.suen@wecistanche.com
Whatsapp/Tel:+86 15292862950
2.3 Quantitative Analysis of 8 Major Compounds in Raw and Wine-Processed Cistanche
2.3.1 System Suitability
Under the chromatographic conditions described, theoretical plate number for echinacoside exceeded 6000 with good resolution (>1.5). Chromatograms of the mixed standard, raw desert Cistanche, and wine-processed samples are shown in Figure 2.
Peak Identification:
Cistanoside F
Echinacoside
Cistanoside A
Verbascoside
Tubuloside A
Isoverbascoside
2'-Acetylverbascoside
Tubuloside B

cistanche deserticola

cistanche tubulosa
2.3.2 Linearity and Detection Limits
Standard calibration curves were established using serial dilutions of the reference mixture at concentrations of 0.1 to 5.0 mL. Calibration curves were generated by plotting concentration (X) versus peak area (Y). Detection limits (LOD, S/N = 3) and quantification limits (LOQ, S/N = 10) were determined and confirmed good linearity across the tested ranges.
2.3.3 Precision
Six replicate injections of the mixed reference solution showed relative standard deviations (RSDs) of peak areas ranging from 0.48% to 2.14%, indicating excellent instrument precision.
2.3.4 Stability
Sample solutions of raw Cistanche powder (Batch No. 160901) were analyzed at 0, 2, 4, 8, 12, and 24 hours. The RSDs of peak areas for all 8 compounds ranged from 0.71% to 1.93%, confirming solution stability within 24 hours.
Table 1. Sample Information of Cistanche Materials
| Source Species | Sample ID | Origin | Batch Number |
|---|---|---|---|
| Cistanche deserticola | H1 | Inner Mongolia | 160901 |
| H2 | Xinjiang | 1712301 | |
| H3 | Xinjiang | 1712305 | |
| H4 | Xinjiang | 1712306 | |
| H5 | Xinjiang | 1712307 | |
| H6 | Inner Mongolia | 1712308 | |
| H7 | Xinjiang | 180710 | |
| H8 | Xinjiang | 180710 | |
| H9 | Xinjiang | 180710 | |
| H10 | Xinjiang | 180711 | |
| Cistanche tubulosa | G1 | Xinjiang | 151201 |
| G2 | Xinjiang | 170301 | |
| G3 | Xinjiang | 1709001 | |
| G4 | Xinjiang | 170601 | |
| G5 | Xinjiang | 1712302 | |
| G6 | Xinjiang | 1712303 | |
| G7 | Xinjiang | 1712304 | |
| G8 | Xinjiang | 180710 | |
| G9 | Xinjiang | 180710 | |
| G10 | Xinjiang | 180712 |

| Echinacoside |
| Cistanoside A |
| Verbascoside |
2.3.5 Repeatability
Six independently prepared replicates of the same Cistanche batch showed good repeatability. Average content (mg·g⁻¹) and RSDs were as follows:
| Compound | Avg. Content (mg/g) | RSD (%) |
|---|---|---|
| Cistanoside F | 0.24 | 1.24% |
| Echinacoside | 4.49 | 0.25% |
| Cistanoside A | 0.56 | 1.93% |
| Verbascoside | 2.52 | 1.40% |
| Tubuloside A | 0.59 | 1.15% |
| Isoverbascoside | 1.49 | 0.71% |
| 2'-Acetylverbascoside | 1.23 | 1.94% |
| Tubuloside B | 0.86 | 1.02% |
2.3.6 Recovery Test
Recovery was tested by spiking six replicates of Cistanche powder (0.1 g) with known concentrations of the 8 reference compounds. Average recoveries ranged from 95.56% to 102.71%, with RSDs between 1.44% and 2.97%, indicating excellent extraction and quantification reliability.

Note: A. Mixed reference; B. Raw Cistanche deserticola; C. Stewed Cistanche deserticola in wine; 1. Cistancheside F; 2. Echinacoside; 3. Cistancheside A; 4. Verbascoside; 5. Tubuloside A; 6. Isoverbascoside; 7. 2΄-acetylverbascoside; 8. Tubuloside B.
2.3.7 Quantification of Active Compounds in Raw vs. Wine-Processed Cistanche
Each sample was tested in duplicate. The 8 target compounds were quantified in 10 batches of Cistanche deserticola (raw and wine-processed) and 10 batches of Cistanche tubulosa. Results are summarized in Table 3, offering insights into:
Species-specific differences in composition
Changes in phytochemical content after wine processing
Analytical fingerprinting for Cistanche quality control
Table 2. Calibration Curves, Correlation Coefficients (r), Linear Ranges, LOD and LOQ for Eight Compounds
| Compound | Calibration Equation | r | Linear Range (µg·mL⁻¹) | LOD (µg·mL⁻¹) | LOQ (µg·mL⁻¹) |
|---|---|---|---|---|---|
| Cistanoside F | Y = 4.89 × 10⁹X + 3.31 × 10³ | 0.9999 | 0.327–32.700 | 0.0521 | 0.1300 |
| Echinacoside | Y = 3.88 × 10⁹X + 1.71 × 10⁴ | 0.9999 | 1.024–102.400 | 0.0422 | 0.1339 |
| Cistanoside A | Y = 5.08 × 10⁹X + 3.45 × 10³ | 0.9999 | 0.502–50.600 | 0.1006 | 0.4035 |
| Verbascoside | Y = 3.88 × 10⁹X + 3.43 × 10³ | 0.9999 | 0.806–80.600 | 0.0732 | 0.1871 |
| Tubuloside A | Y = 4.42 × 10⁹X + 1.07 × 10³ | 0.9999 | 0.256–25.600 | 0.0865 | 0.2876 |
| Isoverbascoside | Y = 4.81 × 10⁹X + 5.29 × 10³ | 0.9999 | 0.863–86.300 | 0.0242 | 0.0734 |
| 2'-Acetylverbascoside | Y = 5.30 × 10⁹X + 2.99 × 10³ | 0.9999 | 0.773–77.300 | 0.0317 | 0.1024 |
| Tubuloside B | Y = 5.17 × 10⁹X + 3.39 × 10³ | 0.9999 | 0.608–60.800 | 0.1794 | 0.3876 |
2.4 Comparative Analysis of Chemical Composition Between Cistanche Species
To investigate the phytochemical differences between Cistanche deserticola and Cistanche tubulosa, the concentrations of eight key phenylethanoid glycosides from 10 batches of raw and wine-processed samples of each species were visualized using box plots (Figure 3). Statistical analysis revealed that, except for 2'-acetylverbascoside and tubuloside B, most other compounds showed significant differences (P < 0.05) between the two species in both raw and processed forms.
Specifically:
In raw Cistanche, the content of cistanoside F, echinacoside, isoverbascoside, tubuloside A, and verbascoside was significantly lower in C. deserticola compared to C. tubulosa (P < 0.05).
The wine-processed samples mirrored similar trends.
Notably, cistanoside A was found at higher levels in C. deserticola and was undetectable in C. tubulosa, suggesting it may serve as a potential marker compound for species differentiation.
PLS-DA Chemometric Analysis of Cistanche Species
A Partial Least Squares Discriminant Analysis (PLS-DA) was performed using the concentration data of the eight compounds. The resulting score plots (Figure 4A) showed that raw and processed samples from both species did not cluster into clearly separated groups.
However, random permutation tests (Figure 4B) revealed that the model was not overfitted, as the true values of R²Y and Q² were higher than those of the permuted models. The relatively low Q² values suggest limited predictability, likely due to intra-group variability and overlapping compound ranges between raw and processed forms.
Further PLS-DA Modeling and VIP Analysis
Separate PLS-DA models were constructed for raw and wine-processed samples of both species to explore species-specific chemical differences. The following were observed:
Score plots (Figures 5A and 5C) showed distinct clustering between C. deserticola and C. tubulosa in both raw and processed forms.
Model validation (Figures 5B and 5D) confirmed good predictive power without overfitting.
Variable Importance in Projection (VIP) plots (Figures 6A and 6B) identified key compounds contributing to species discrimination:
For raw samples: Cistanoside A, cistanoside F, echinacoside, and verbascoside were most informative.
For wine-processed samples: Cistanoside A and tubuloside B played dominant roles.
2.5 Impact of Wine Processing on Cistanche Phytochemistry
Due to substantial variation in compound content across batches, paired comparisons were made between raw and wine-processed samples of the same batch. The results, visualized using violin plots (Figure 7), revealed the following:
In C. deserticola, levels of 2'-acetylverbascoside, cistanoside A, cistanoside F, echinacoside, tubuloside A, and verbascoside significantly decreased post-processing (P < 0.05), while tubuloside B increased.
In C. tubulosa, levels of 2'-acetylverbascoside, echinacoside, and verbascoside also decreased, while isoverbascoside and tubuloside B increased significantly (P < 0.05).
These findings suggest wine processing may lead to hydrolysis, isomerization, or chemical transformation of active ingredients.
3. Discussion
According to the 2020 edition of the Chinese Pharmacopoeia, Cistanche deserticola must contain no less than 0.3% of the combined content of echinacoside and verbascoside, whereas Cistanche tubulosa must contain no less than 1.5% of these two compounds. In this study, all raw and processed samples-except one batch (180710)-met these standards.
Despite batch-to-batch variability within each species (some compounds differed by up to 10-fold, such as tubuloside A and isoverbascoside), statistically significant differences in compound content were consistently observed between the two species. This confirms that species origin is a major factor influencing phytochemical composition.
In addition, cistanoside A was only detected in C. deserticola and absent in C. tubulosa, making it a valuable marker for species authentication, especially in pharmacognostic or quality control settings.
🔬 Effect of Wine Processing on Chemical Composition
After wine processing, both species showed a consistent trend:
Decreased levels of:
Cistanoside F, echinacoside, cistanoside A, verbascoside, tubuloside A, and 2'-acetylverbascoside
Increased levels of:
Tubuloside B and isoverbascoside
These trends may result from chemical hydrolysis, degradation, or structural rearrangement during the steaming process. Interestingly, the magnitude and direction of changes varied across batches, likely due to differences in:
Initial compound concentrations
Herb morphology (size, thickness)
Sensitivity to processing conditions
This highlights the importance of standardizing processing parameters and conducting batch-specific quality assessments during herbal preparation.