Effect Of Brewing Temperature On Flavor Compounds And Antioxidant Activity Of Cistanche Deserticola Tea Infusion
Aug 10, 2026
(Marketing-optimized scientific translation for product development & consumer education; complete content preserved)
Abstract
This study investigated how brewing temperature affects the infusion quality of two Cistanche deserticola tea materials: (1) a vacuum freeze-dried upper part of the fleshy stem, and (2) a vacuum freeze-dried + baked lower part of the fleshy stem. Brewing temperatures ranging from 80 to 100 °C were evaluated for their influence on antioxidant activity and sensory flavor characteristics.
Tea infusion color, echinacoside, acteoside, total phenols, total flavonoids, antioxidant capacity, and volatile flavor compounds were determined using multiple analytical techniques including high-performance liquid chromatography (HPLC) and an electronic nose.
Results indicated that the optimal brewing temperature for the freeze-dried type was 85 °C. At this temperature, the infusion showed a clear light-yellow color, and 13 flavor compounds were detected. The concentrations of acteoside (201.07 μg/mL) and total flavonoids (2.43 mg/mL) reached their highest values among all tested temperatures.
For the vacuum freeze-dried + baked type, the optimal brewing temperature was 100 °C. At this temperature, 14 flavor compounds were identified, including two unique compounds: 1-hydroxy-2-butanone and 2-ethylhexanol. Echinacoside (175.88 μg/mL), total phenols (0.41 mg/mL), total flavonoids (1.69 mg/mL), and DPPH radical scavenging activity (3.06 μmol/mL) all reached their highest levels.
Overall, this study provides theoretical support for processing optimization and proper brewing guidance for C. deserticola tea-helping translate measurable bioactive content into cistanche real benefits for everyday use.
Keywords: brewing temperature; Cistanche deserticola tea infusion; flavor compounds; chromatographic techniques; antioxidant activity

1. Introduction (TCM relevance explained for Western readers)
Cistanche deserticola (Rou Cong Rong) is a holoparasitic plant in the Orobanchaceae family, mainly distributed in the northwestern desert regions of China. It is a well-known traditional Chinese herb that is also used as a food-medicine ingredient.
Its major bioactive constituents are phenylethanoid glycosides (PhGs). Among them, echinacoside and acteoside (verbascoside) are used as key quality-control markers in the Chinese Pharmacopoeia.
However, traditional preprocessing often uses whole-stem slicing or mixed processing, without fully considering that different parts of the stem may have different thermal stability. This can cause heat-sensitive actives (such as acteoside) in the upper portion to degrade, leading to inconsistent quality.
Table 1. PEN3 electronic nose sensor array and performance characteristics
| No. | Sensor | Performance description |
|---|---|---|
| 1 | W1C | Sensitive to aromatic compounds (aromatics) |
| 2 | W5S | High sensitivity; sensitive to nitrogen oxides (NOx) |
| 3 | W3C | Sensitive to aromatic compounds and ammonia (NH3_33) |
| 4 | W6S | Mainly selective for hydrogen (H2_22) |
| 5 | W5C | Sensitive to short-chain alkanes/aromatic components |
| 6 | W1S | Sensitive to methyl compounds |
| 7 | W1W | Sensitive to sulfur compounds |
| 8 | W2S | Sensitive to alcohols and aldehydes |
| 9 | W2W | Sensitive to aromatic compounds and organic sulfur compounds |
| 10 | W3S | Sensitive to long-chain alkanes |
Modern processing methods are more mature, but commonly face issues such as long processing time and insufficient retention of key actives. To address these bottlenecks, Tang Yao et al. proposed a precision-oriented processing strategy: the upper and lower parts are processed differently (freeze-drying for the upper part; freeze-drying plus baking for the lower part). Compared with sun-drying, echinacoside in the upper part increased 1.8×, and acteoside in the lower part increased 4.2×, offering a clear route to higher-activity raw materials.
With the growth of the global wellness industry, more deep-processed Cistanche products (plant beverages, compound tablets, etc.) are being developed. Yet these often require complex extraction/purification steps-raising cost and potentially causing additional loss of active compounds.
In contrast, Cistanche tea is simple to manufacture, flexible in formulation, and aligns with the traditional "food as medicine" concept-making it a practical way to preserve the herb's natural active profile. Current research has focused mostly on composition analysis, pharmacology, and deep-processing; systematic studies on how brewing conditions affect both bioactives and aroma compounds in the infusion are still limited.
Therefore, this study used precision-processed Cistanche tea materials-upper freeze-dried and lower freeze-dried + baked-to systematically explore how brewing temperature influences tea quality. Using HPLC for echinacoside/acteoside quantification, plus total phenols (TPC), total flavonoids (TFC), DPPH and FRAP antioxidant assays, and volatile analysis via electronic nose and LVHS-TD-GC-MS, we aim to clarify the relationship between brewing temperature and tea quality, supporting better processing and consumer brewing guidance-and helping consumers connect lab results to cistanche real benefits.
2. Materials and Methods
2.1 Materials and reagents
Cistanche samples were harvested in March 2025 from Turpan, Xinjiang Uygur Autonomous Region, China. Brewing water was purchased from Beijing Shanwai Renjia Water Co., Ltd.
Reagents included HPLC-grade methanol and acetonitrile; analytical-grade sodium carbonate, aluminum chloride hexahydrate, glacial acetic acid; gallic acid, rutin, TPTZ, DPPH, sodium nitrite, Trolox; sodium hydroxide, sodium acetate, hydrochloric acid, ferric chloride hexahydrate; ascorbic acid; and Folin–Ciocalteu reagent.
Table 2. Effects of different brewing temperatures on color parameters of C. deserticola tea infusions
| Temperature (°C) | L* | a* | b* | ΔE |
|---|---|---|---|---|
| 80 | 93.58 ± 0.28 | −2.91 ± 0.02 | 21.30 ± 0.15 | 96.01 ± 0.29 |
| 85 | 90.75 ± 0.07 | −3.48 ± 0.24 | 33.91 ± 0.38 | 96.94 ± 0.08 |
| 90 | 89.85 ± 0.24 | −3.89 ± 0.13 | 37.07 ± 1.09 | 97.28 ± 0.30 |
| 95 | 90.96 ± 0.22 | −2.48 ± 0.26 | 26.19 ± 0.57 | 94.69 ± 0.20 |
| 100 | 91.56 ± 0.11 | −2.57 ± 0.23 | 28.62 ± 0.38 | 95.96 ± 0.07 |
Lower part (vacuum freeze-dried + baked type)
| Temperature (°C) | L* | a* | b* | ΔE |
|---|---|---|---|---|
| 80 | 90.58 ± 0.40 | −1.31 ± 0.31 | 25.87 ± 0.93 | 94.21 ± 0.29 |
| 85 | 96.93 ± 0.41 | −0.94 ± 0.15 | 14.09 ± 0.07 | 97.96 ± 0.41 |
| 90 | 95.59 ± 0.09 | −0.76 ± 0.08 | 17.46 ± 0.19 | 97.18 ± 0.11 |
| 95 | 94.78 ± 0.12 | −0.82 ± 0.12 | 18.65 ± 0.21 | 96.60 ± 0.11 |
| 100 | 94.47 ± 0.35 | −0.96 ± 0.42 | 20.10 ± 0.54 | 96.59 ± 0.41 |
Note: Different superscript lowercase letters in the original table indicate significant differences within the same column (P<0.05P < 0.05P<0.05). (Superscripts omitted here for clean B2B layout.)
2.2 Instruments and equipment
Electronic analytical balance; thermostatic water bath; freeze dryer; electric oven; centrifuge; microplate reader; HPLC system (Shimadzu LC-20A); LVHS-TD-GC-MS (Agilent 8890-5977C); electronic nose (PEN3, AIRSENSE, Germany).
2.3 Methods
2.3.1 Sample preparation
Based on the core morphological pattern-lower part compact/wide/short and upper part loose/narrow/long-the fleshy stem was divided into upper and lower sections and sliced.
After pre-freezing at –80 °C for 2–4 h, slices were vacuum freeze-dried at <20 Pa with cold-trap temperature < –40 °C for 20–24 h until moisture reached 5%–8%, producing the upper vacuum freeze-dried type.
The lower part was freeze-dried and then baked at 70 °C for 8 h, producing the lower freeze-dried + baked type.
Five portions of 0.5 g upper tea and five portions of 0.5 g lower tea were placed into 50 mL bottles. With a material-to-liquid ratio of 1:50 (g/mL), 25.0 mL water was added. Samples were brewed in a water bath at 80, 85, 90, 95, 100 °C for 30 min, filtered, centrifuged at 6000×g, 25 °C for 10 min, and supernatants were stored for testing.
2.3.2 Color difference of tea infusion
Color parameters L* (brightness), a* (red/green), b* (yellow/blue), and total color difference ΔE were measured by a spectrophotometer using mineral water as reference.
2.3.3 Determination of echinacoside and acteoside (HPLC)
Chromatographic conditions: Kromasil C18 (250 mm × 4.6 mm, 5 μm), 30 °C, injection 20 μL, mobile phase A 0.1% acetic acid aqueous, B 0.1% acetic acid-acetonitrile, flow 1 mL/min, gradient program as listed in the original text, detection at 330 nm.
Standards: 2 mg/mL echinacoside and acteoside standards; diluted with 50% methanol to 15.625 μg/mL for calibration.
Calibration curves:
Echinacoside: Y=35713X−1697Y = 35713X - 1697Y=35713X−1697, R2=0.9997R^2 = 0.9997R2=0.9997
Acteoside: Y=65874X−1544.8Y = 65874X - 1544.8Y=65874X−1544.8, R2=0.9999R^2 = 0.9999R2=0.9999
2.3.4 Total flavonoids (TFC)
Modified from Tang Yao et al.; absorbance at 510 nm. Rutin standard curve: Y=0.0003X+0.0439Y = 0.0003X + 0.0439Y=0.0003X+0.0439, R2=0.9996R^2 = 0.9996R2=0.9996. Units: mg/mL rutin equivalents.
2.3.5 Total phenols (TPC)
Modified Folin–Ciocalteu method; absorbance at 765 nm. Gallic acid curve: Y=0.0044X+0.1112Y = 0.0044X + 0.1112Y=0.0044X+0.1112, R2=0.9983R^2 = 0.9983R2=0.9983. Units: mg/mL gallic acid equivalents.
2.3.6 Antioxidant activity
DPPH scavenging: absorbance at 517 nm after 4 h dark reaction. Trolox curve: Y=−0.0011X+2.0246Y = -0.0011X + 2.0246Y=−0.0011X+2.0246, R2=0.9991R^2 = 0.9991R2=0.9991. Units: μmol/mL Trolox equivalents.
FRAP: absorbance at 593 nm after 2 h reaction. Ascorbic acid curve: Y=0.0017X+0.0925Y = 0.0017X + 0.0925Y=0.0017X+0.0925, R2=0.9997R^2 = 0.9997R2=0.9997. Units: mmol/mL ascorbic acid equivalents.
2.3.7 Flavor compounds
Electronic nose: 0.4 g tea + 20.0 mL mineral water (1:50), brewed 30 min at each temperature, filtered to vials, cooled to room temperature; stable region (~100 s) used for analysis; 3 replicates.
LVHS-TD-GC-MS: 50 mL infusion placed in 1 L glass bottle. Column HP-5MS UI (30 m × 0.25 mm, 0.25 μm), helium 1.0 mL/min, inlet 250 °C, split/splitless; temperature program listed; compounds identified with NIST20 database.
2.4 Data analysis
All experiments were performed in triplicate. Excel 2019 for processing; GraphPad Prism 5 for significance testing (P < 0.05); Origin 2025b for plotting.
Table 3. Qualitative analysis of volatile compounds in C. deserticola tea infusions at different brewing temperatures
| No. | CAS No. | Formula | Volatile compound | Aroma description |
|---|---|---|---|---|
| 1 | 124-19-6 | C8_88H18_{18}18O | 1-Octanol | Fatty, slightly bitter odor |
| 2 | 112-31-2 | C10_{10}10H20_{20}20O | Decanal | Citrus-like |
| 3 | 66-25-1 | C6_66H12_{12}12O | Hexanal | Grass-like/green |
| 4 | 122-78-1 | C8_88H8_88O | 2-Phenylacetaldehyde | Honey, rose, floral |
| 5 | 96-17-3 | C5_55H10_{10}10O | 2-Methylbutanal | Slight fruity and chocolate-like |
| 6 | 124-13-0 | C8_88H16_{16}16O | Octanal | Orange-like/citrus |
| 7 | 100-52-7 | C7_77H6_66O | Benzaldehyde | Almond-like |
| 8 | 75-18-3 | C2_22H6_66S | Dimethyl sulfide | Seaweed-like |
| 9 | 123-86-4 | C6_66H12_{12}12O2_22 | Butyl acetate | Strong fruity (banana, apple-like) |
| 10 | 79-20-9 | C3_33H6_66O2_22 | Methyl acetate | Fruity |
| 11 | 123-66-0 | C6_66H12_{12}12O2_22 | Ethyl butyrate | Strong fruity (pineapple-like) |
| 12 | 112-32-3 | C8_88H16_{16}16O | 1-Octen-3-one | Musty/earthy odor |
| 13 | 14073-97-3 | C10_{10}10H18_{18}18O | L-Isopulegol | Characteristic mint-like odor |
| 14 | 491-07-6 | C10_{10}10H18_{18}18O | Isomenthone | Minty |
| 15 | 5077-67-8 | C5_55H8_88O2_22 | 1-Hydroxy-2-butanone | Ethyl acetate-like; baked-note |
| 16 | 600-14-6 | C5_55H8_88O2_22 | 2,3-Pentanedione | Milky, sweet, almond-like; caramel note |
| 17 | 13466-78-9 | C10_{10}10H16_{16}16 | 3-Carene | Pine/woody |
| 18 | 67-71-0 | C2_22H6_66OS | Dimethyl sulfone | Naturally present in many fruits/vegetables/whole grains (incl. milk); slightly bitter |
| 19 | 3777-69-3 | C9_99H14_{14}14O | 2-Pentylfuran | Fruity, green, grassy |
| 20 | 111-27-3 | C6_66H14_{14}14O | 1-Hexanol | Characteristic odor; present in sweet orange and apples |
| 21 | 104-76-7 | C8_88H18_{18}18O | 2-Ethylhexanol | Rose-like floral, fruity |
3. Results and Analysis
3.1 Effect of brewing temperature on infusion color
Color is a key objective indicator of tea quality and consumer acceptance.
For the upper freeze-dried infusion, L* decreased then increased with temperature. Brightness was highest at 80 °C (93.58) and lowest at 90 °C (89.85). The a* value was lowest at 90 °C (–3.89) (more green), while b* (yellowness) was highest at 90 °C (37.07) and second-highest at 85 °C (33.91). Total color difference ΔE peaked at 85 °C (97.28) and 90 °C (96.94) with significant differences versus other temperatures.
For the lower freeze-dried + baked infusion, L* rose then fell, peaking at 85 °C (96.93). a* remained slightly negative across temperatures (still greenish). b* was highest at 80 °C (25.87), lowest at 85 °C (14.09), and slightly recovered at 100 °C (20.10). ΔE peaked at 85 °C (97.96) with significant differences.
Overall, 80–85 °C helped maintain a brighter, clearer golden-yellow infusion, while 90–100 °C tended to deepen color and reduce brightness.
3.2 Effect on echinacoside and acteoside dissolution
Echinacoside and acteoside are key phenylethanoid glycosides and important quality markers.
In the upper freeze-dried infusion, the total concentration of echinacoside + acteoside increased then decreased, peaking at 85 °C (232.7 μg/mL), and the acteoside concentration also peaked at 85 °C (201.07 μg/mL).
In the lower freeze-dried + baked infusion, echinacoside increased with temperature, reaching the highest at 100 °C (175.88 μg/mL). The combined total of echinacoside + acteoside was highest at 85 °C (271.93 μg/mL), with 100 °C (231.72 μg/mL) as second highest.
Mechanistically, echinacoside (a trisaccharide glycoside) is more thermally stable, so higher temperature primarily improves extraction. Acteoside (a disaccharide glycoside) is more heat sensitive and may degrade or isomerize at high temperatures, limiting total increases.
3.3 Effect on total phenols (TPC) and total flavonoids (TFC)
Under fixed brewing time (30 min) and ratio (1:50), both TPC and TFC differed significantly across temperatures (P < 0.05).
For the upper freeze-dried infusion:
TPC peaked at 90 °C (0.51 mg/mL), 111% higher than at 80 °C.
TFC peaked at 85 °C (2.43 mg/mL), dropped to the lowest at 90 °C (0.95 mg/mL), then rose again.
For the lower freeze-dried + baked infusion:
TPC decreased then increased, peaking at 100 °C (0.41 mg/mL).
TFC generally increased with temperature, peaking at 100 °C (1.69 mg/mL).
This suggests different "extraction vs. degradation" balances caused by tissue structure and processing method.
3.4 Effect on antioxidant activity
For the upper freeze-dried infusion, DPPH and FRAP both increased then decreased with temperature, peaking at 90 °C:
DPPH: 4.52 μmol/mL, 148% higher than at 80 °C
FRAP: 2.47 mmol/mL
For the lower freeze-dried + baked infusion, DPPH decreased then increased, peaking at 100 °C (3.06 μmol/mL). FRAP was highest at 80 °C (1.76 mmol/mL), with 100 °C (1.70 mmol/mL) not significantly different.
From a wellness education perspective: antioxidant assays help consumers understand one part of cistanche real benefits-the infusion contains measurable compounds capable of neutralizing free radicals in these lab models.
3.5 Effect on flavor compounds
3.5.1 Electronic nose
Both infusions showed similar overall response patterns, with high responses on sensors linked to sulfur compounds, nitrogen oxides, and hydrocarbons. The W2S sensor differed significantly among temperatures; responses were higher at 80–85 °C, implying more alcohols/aldehydes/ketones at these lower temperatures. Higher temperature likely increased volatilization and thermal degradation, reducing detectable amounts.
3.5.2 PCA of aroma profiles
For upper freeze-dried infusion, PC1 and PC2 explained 62.7% of variance; for lower freeze-dried + baked infusion, they explained 70.4%. Samples brewed at different temperatures separated clearly, confirming temperature as a key factor shaping aroma.
3.5.3 LVHS-TD-GC-MS identification
Volatiles were mainly aldehydes, ketones, and esters; the lower freeze-dried + baked infusion also had small amounts of alcohols.
Upper freeze-dried infusion: 13 compounds detected (6 aldehydes, 3 esters, 3 ketones, 1 ether). At 85 °C, aldehydes like nonanal, hexanal, and 2-methylbutanal were higher, with a unique compound octyl formate (fruity). At 100 °C, unique compounds such as methyl acetate (fruity) and 2,3-pentanedione (milky/sweet/caramel-like) were detected.
Lower freeze-dried + baked infusion: 14 compounds detected (6 aldehydes, 2 alcohols, 2 ketones, 1 ester, plus dimethyl sulfone, 2-pentylfuran, 3-carene). At 100 °C, the most compounds were detected (13), and phenylacetaldehyde (honey/rose/floral) and isomenthone (minty) were significantly higher. Two unique compounds-1-hydroxy-2-butanone and 2-ethylhexanol-appeared only at 100 °C, enriching aroma complexity.
Conclusion on flavor:
85 °C is best for upper freeze-dried tea, emphasizing fresh, fruity, herbal notes (aldehyde enrichment).
100 °C is best for lower freeze-dried + baked tea, emphasizing honey-like sweetness and floral notes (ketone/alcohol formation).
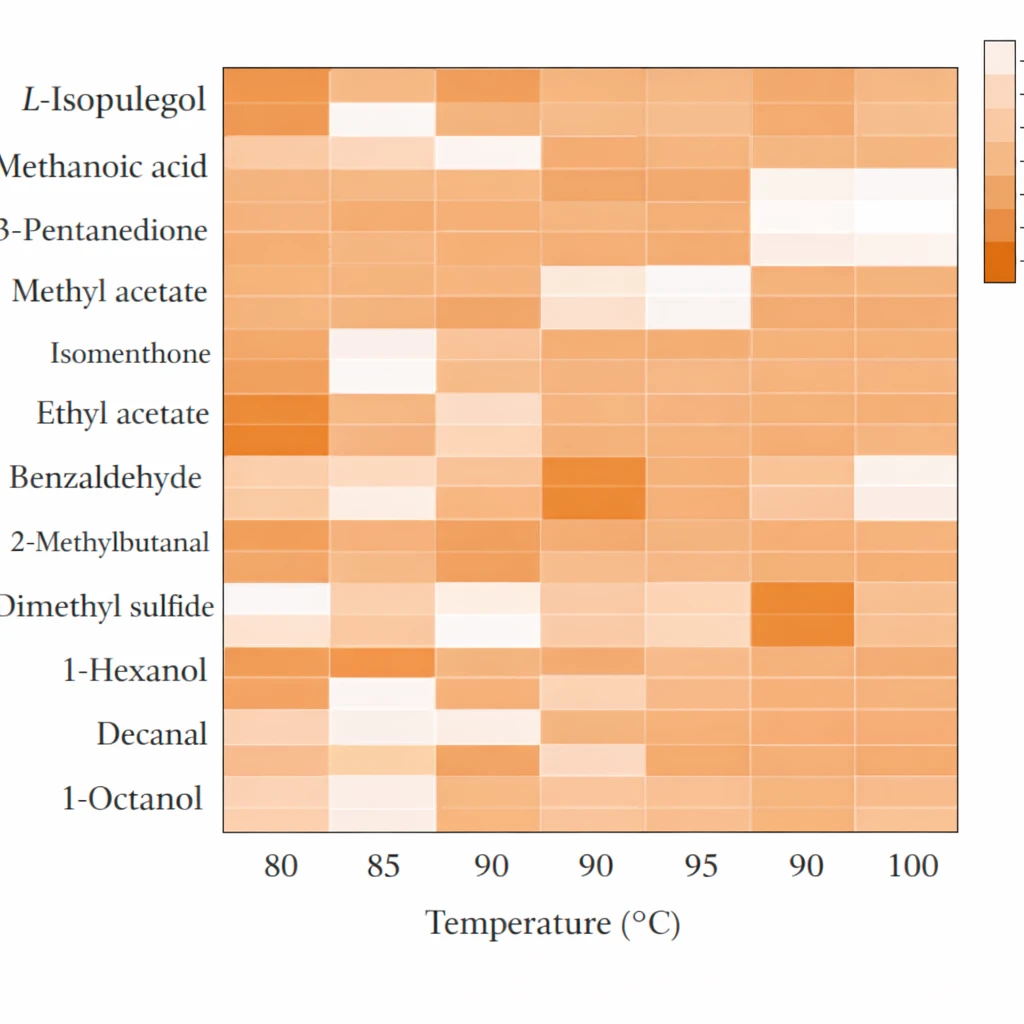
Fig. 7 Clustered heatmaps of volatile components in tea infusions from the vacuum freeze-dried type (A) and the vacuum freeze-dried and baked type (B) of C. deserticola tea at different brewing temperatures
4. Discussion and Conclusion (clear brewing guidance + product implications)
Using HPLC, spectrophotometry, electronic nose, and LVHS-TD-GC-MS, this study evaluated how brewing temperature (80–100 °C) affects nutrients, antioxidant capacity, and flavor for precision-processed Cistanche teas.
For upper freeze-dried tea, echinacoside + acteoside were highest at 85 °C; TPC peaked at 90 °C; TFC peaked at 85 °C. Antioxidant activity (DPPH and FRAP) was strongest at 90 °C.
For lower freeze-dried + baked tea, echinacoside + acteoside were highest at 85 °C, while TPC and TFC peaked at 100 °C. DPPH was strongest at 100 °C.
In terms of sensory properties, the lower freeze-dried + baked infusion generally had higher brightness (L*), and different temperature windows created distinct aroma signatures.
Final brewing recommendation:
Upper freeze-dried Cistanche tea: 85 °C
Lower freeze-dried + baked Cistanche tea: 100 °C
Limitations: only single-brew and single temperature gradient were studied; time-temperature interaction and human sensory panel validation were not included. Future work may optimize parameters (temperature, time, tea/water ratio, water mineral content/pH) and build predictive regression models to better explain PhG degradation and aroma formation mechanisms.
How to Turn This Science into "Cistanche Real Benefits" for Western Consumers (Marketing-ready framing)
When developing products for the EU/US market, the above results can be expressed in a simple, compliant consumer logic:
Bioactive markers are measurable
Echinacoside and acteoside are quantifiable-this supports product standardization and quality storytelling, which is central to "cistanche real benefits".

Processing + brewing can be optimized
Different parts and processing methods yield different optimal brewing temperatures, so you can deliver a more consistent user experience (taste + functional perception).
Antioxidant activity is a relatable bridge
While antioxidant assays are not direct clinical outcomes, they provide a familiar "wellness language" for Western audiences: supporting oxidative balance.
About Our Factory (for product developers & brand partners)
We are a professional natural Cistanche extract manufacturer focused on Cistanche tubulosa-a variety widely recognized in industry for higher levels of key actives (such as echinacoside/acteoside) when properly cultivated and processed.


Based on our company profile:
Established in 2003 with a fully integrated Cistanche supply chain (seed breeding, cultivation base, collection/storage, and GMP processing).
Large-scale production capacity and quality management systems (including GMP workshop and multiple certifications).
Strong scientific collaboration and R&D foundation to support standardized extract development for functional foods, supplements, and related applications.
This production foundation is critical for delivering consistent "cistanche real benefits"-because in botanical products, efficacy perception depends heavily on standardized actives, reliable sourcing, and reproducible processing.
If you want, I can also deliver:
A shorter EU/US landing-page version (800–1200 words) with stronger conversion copy.
A B2B ingredient sales deck outline (claims-safe wording + COA/spec hooks).
Two brewing guides formatted for packaging: "85 °C Upper" and "100 °C Lower".
Tell me your target format (Amazon listing, Shopify landing page, distributor brochure, or whitepaper) and your target market (US/EU/UK), and I'll adapt the wording to match typical compliance expectations.