PART 1 Application Of 1H NMR-based Metabolomics For Discrimination Of Different Parts And Development Of A New Processing Workflow For Cistanche Deserticola
Mar 06, 2022
Pingping Zou
Pingping Zoua,†, Yuelin Songb,†, Wei Leia, Jun Lib, Pengfei Tua,b,
Yong Jiang,⁎
acetate Key Laboratory of Natural and Biomimetic Drugs, School of Pharmaceutical Sciences, Peking University, Beijing 100191, China modern Research Center for Traditional Chinese Medicine, School of Chinese Materia Medica, Beijing University of Chinese Medicine, Beijing 100029, China
Received 17 May 2017; revised 20 June 2017; accepted 17 July 2017
Abstract: Cistanche deserticola (CD) is one of the two authoritative source plants of Cistanches Herba, a well-known medicinal plant. Herein, 1H NMR spectroscopy was employed to characterize the chemical profile and to distinguish the different parts, as well as to propose a new processing workflow for CD. The signal assignment was achieved by multiple one and two-dimensional NMR spectroscopic techniques in combination with available databases and authentic compounds. The upper parts of the plant were distinguished from the lower parts by combining the 1H NMR spectroscopic dataset with multivariate statistical analysis. A new processing method that hyphenated steaming with freeze-drying was demonstrated to be superior to either steaming coupled with oven-drying or direct freeze-drying via holistic 1H NMR-based metabolomic characterization. Phenylethanoid glycosides, mainly echinacoside and acteoside, were screened out and confirmed as the chemical markers responsible for exhibiting the superiority of the new processing workflow, whereas serial primary metabolites, especially carbohydrates and tricarboxylic acid cycle metabolites, were found as the primary molecules governing the discrimination between the upper and lower parts of the plant. Collectively, 1H NMR spectroscopy was demonstrated as a versatile analytical tool to characterize the chemical profile and to guide the in-depth exploitation of CD by providing comprehensive qualitative and quantitative information.
KEY WORDS:Cistanche deserticola; 1H NMR-based metabolomics; Processing workflow; Different parts; Phenylethanoid glycoside; Tricarboxylic acid cycle metabolites; Echinacoside; Acteoside
For more information please contact: Joanna.jia@wecistanche.com
Cistanche deserticola has many effects, click here to know more
1. Introduction
Cistanches Herba (CH, Chinese name: Roucongrong), initially archived in Shen Nong's Chinese Materia Medica, has been extensively regarded as one of the most well-known edible tonic and medicinal plants, and honored as “Ginseng of the deserts”1,2. As one of the two official source plants of CH, Cistanche deserticola (CD, Orobanchaceae) is a holoparasitic plant and mainly distributed in the north and northwest of China2,3. It has been widely utilized for the treatments of kidney deficiency characterized by impotence, pain in the loins and knees, female sterility, and constipation in traditional Chinese medicinal practices for centuries3–5. However, the wild sources of CD are on the edge of extinction in recent years due to over-harvesting, and it has been listed as one of the class II plants needing protection in China1. Moreover, CD offers an important contribution to desert control. Therefore, it is critical but challenging to use this herbal material more efficiently.
Scientific studies on Cistanche plants initiated in the 1980s6. Phytochemical investigations revealed the existence of diverse chemical types, e.g., phenylethanoid glycosides (PhGs), iridoids, lignans, fatty acids, alditols, and carbohydrates, within CD7. Among them, PhGs are most frequently mentioned owing to their broad spectrum of biological activities, including anti-oxidation, anti-aging, anti-fatigue, anti-inflammation, enhancing body immunity, improving the learning and memory of Alzheimer's disease mice, etc1. Recently, PhGs are attracting increasing attention as potential new drug candidates for treating neurodegenerative disorders. In particular, an amalgamation of the total PhGs found in CH has been developed as a new drug, registered as total Cistanche glycoside capsule (Memoregain®) for the treatment of vascular dementia8. Echinacoside, the most abundant and effective constituent of the total PhGs exhibits anti-apoptotic effects on SHSY5Y neuronal cells following TNFα-induced apoptosis and reverses deficits in Parkinson's disease mice9. Moreover, another primary active compound, acteoside (also known as verbascoside) is able to antagonize the apoptosis in neurons10 to defend against neurotoxicity in PC12 cells induced by 1-methyl-4-phenylpyridium or glutamate11, and to improve scopolamine-induced memory deficits2.

Similar to Cordyceps and Ginseng, the CD has been extensively consumed and valued as health food. The actual and perceived benefits of CD are likely to play the determinant roles for the price of the crude drug. Given the large body of the crude drugs of CD, the slices are more popular in the market. In general, enzymatic inactivation and water deprivation are the two key steps during medicinal slice processing. The conventional drying methods of CD include insulation, oven-drying, salting, and cellar storage. However, products from these processes usually suffer from ill-looking appearance and low content of PhGs, thus hindering the wide application and consumption of CD. In 2007, our group proposed a new processing technique for CD which dramatically preserved the contents of echinacoside and acteoside in slices14. However, since the products from this process still suffer from an unpleasant appearance, we presently describe a processing methodology to improve the appearance and to further preserve the contents of PhGs in the processed materials.
Serial analytical tools have hitherto been applied for the chemical analysis of CD, including thin-layer chromatography, high-performance liquid chromatography (HPLC) coupled with various detectors, such as diode array detector (DAD), evaporative light scattering detector (ELSD), electron capture detector (ECD), and tandem mass spectrometer (MS/MS). PhGs, in particular echinacoside and acteoside, have been most frequently adopted as the quality markers1. The fingerprint of this herbal drug has also been developed using HPLC–DAD and HPLC–DAD–MS/MS15,16. Nonetheless, it remains a challenge to assess the quality of CD because of its extremely complex chemical profile. Generally speaking, approaches targeting several analytes are not able to offer a holistic chemical view for the crude extracts, although abundant qualitative and quantitative information can be obtained from LC−MS/MS. Moreover, HPLC- related analytical strategies can be limited by large amounts of solvents, tedious sample preparation, and/or time-consuming procedures. There- fore, a new fit-for-purpose analytical tool being capable of yielding comprehensive information of the compound pool is required for optimal chemical analysis. Fortunately, 1H NMR spectroscopy has been exactly demonstrated as an attractive “all in one” tool being capable of offering not only qualitative dataset but also quantitative information for a wide range of both primary and secondary metabolites with simple sample preparation and rapid acquisition17–20. Until now, wide applications of 1H NMR spectroscopy have been launched for simultaneous determination, chemical profiling, and metabolomics of complex matrices.
Although several investigations have been carried out for this precious herbal medicine, its global chemical profile is largely unknown. Because CD is a parasitic plant, the lower parts should be responsible for transmitting nutrient substances, mainly primary metabolites, from the host towards the upper parts, whereas vigorous energy metabolism, such as blossom, usually occurs in the upper parts. Therefore, it is reasonable to assume that differences occur for the metabolome of different parts. Therefore, in the current study, we aim 1) to comprehensively characterize the chemical profile of CD using 1H NMR spectroscopy coupled with diverse two dimensional (2D) NMR measurements; 2) to clarify the differences between the upper and the lower parts, and 3) to propose a new processing workflow through 1H NMR-based metabolomic study. The findings obtained are expected to provide solid guidelines for the further exploitation of this medicinal herb in a better way, in particular for the employment of different parts and processing techniques.

2. Experimental
2.1. Plant materials
Twelve batches of fresh materials (CD1–CD12, Table S1, Supplemental information) were collected from Inner Mongolia, Xinjiang, and Ningxia autonomous regions in China. The botanical origins of all crude materials were authenticated as
1H NMR-based metabolomics of Cistanche deserticola 649 C. deserticola by one of the authors, Prof. Pengfei Tu. All voucher specimens are deposited at the herbarium of Modern Research Center for Traditional Chinese Medicine, Peking University (Beijing, China).
2.2. Chemical and reagents
Methanol-d4 (CD3OD, deuterium abundance, 99.8 atom % D), deuterated water (D2O, deuterium abundance, 99.8 atom % D), and sodium 3-trimethylsilyl [2,2,3,3-d4] propionate (TSP-d4) were obtained from Cambridge Isotope Laboratories (Andover, MA, USA). Analytical grade methanol was purchased from Beijing Chemical Works (Beijing, China).
Authentic compounds, including echinacoside, acteoside, and mannitol, were purified from CD in our laboratory previously14, and sucrose, β-galactose, along with β-glucose were supplied by Sigma–Aldrich (St. Louis, MO, USA). The purities of all references were determined to be more than 98% by HPLC–UV and 1H NMR analyses.
2.3. Sample preparation
All crude materials (CD1–CD11) except CD12 were chopped into the upper parts (GU) and the lower parts (GD) at the middle of the entire stems, and all parts were cut into thin slices (approximately 6-mm-thick each). Subsequently, all slices of CD1–CD12 were successively steamed for 10 min and oven-dried at 60 °C for 48 h to yield a-type samples. Two other processing methods, including direct freeze-drying and 10-min steaming followed by sequential freeze-drying, were carried out for some selected samples, including CD1-GU, CD4-GU, CD4-GD, CD11-GD, and CD12, to afford two additional sets of processed samples (b- and c-type samples). The detailed descriptions of all samples are illustrated in Table S1. Prior to extraction, all processed slices were crushed into powders with a sample mill (model YF102, Ruian Yongli Pharmacy Machinery, China) and sifted through an 80 mesh sieve. The pulverized plant materials were then accurately weighed (approximately 200 mg for each) and extracted with 50-fold of 50% aqueous methanol (w/v) in an ultrasonic water bath (25 °C) for 40 min. Afterward, 50% aqueous methanol was added to compensate for the lost weight during the extraction. Each extract was centrifuged at 10,000×g at 10 °C for 10 min and filtered through a 0.22 μm membrane. Aliquots (2 mL) of the supernatant were subsequently evaporated and further exsiccated using vacuum drying at 30 °C for 30 min. The dried residues of each sample were reconstituted using a 0.5 mL mixture (1:1, v/v) of CD3OD and phosphate buffer in D2O containing 0.05% TSP-d4 (pH 7.4), and the solution was then transferred into a 5 mm (i.d.) NMR tube (Norell ST500-7) for NMR assays. Each sample was analyzed in triplicate.
2.4. NMR measurements
All 1H NMR, 13C NMR, and 2D NMR spectra were recorded on a Varian Unity Plus 500 MHz spectrometer (Varian Inc., Palo Alto, CA, USA) at 499.91 MHz proton frequency equipped with TCI cryoprobe and Z-gradient system. Identical parameters were applied for both extracts and reference compounds to obtain comparable spectra. For 1H NMR measurements, 256 scans were acquired with the following parameters: spectra width, 8012.6 Hz (16 ppm); pulse width, 11.05 μs (flip angle 90°); acquisition time, 2.04 s; relaxation delay (d1), 2 s; and temperature, 298 K. CD3OD was employed to lock the field frequency, and the chemical shifts of all spectra were aligned using the signal from TSP-d4 at δ 0.00. A wet procedure was adopted to suppress the intensity of the H2O signal that resided around δ 3.3021. An exponential function with line broadening (LB) factor as 0.3 Hz was applied, and the data were zero-filled to give at least five data points above the half-width for each resonance to guarantee precise and reliable integration. The free induction decay (FID) signals were Fourier transformed (FT), and all the spectra were manually phased and corrected using an automated polynomial baseline program.
To assist the chemical characterization and signal assignment,
13C NMR and various 2D NMR analyses, such as 1H–1H
correlation spectroscopy (1H–1H COSY), heteronuclear single quantum coherence spectroscopy (HSQC), and heteronuclear multiple bond correlation spectroscopy (HMBC) were also acquired for a representative sample (CD1-GUI) using those defaulted programs. The spectral width for COSY was δ 0.5–10.0 in both dimensions and 128t1 increments for each t1. Sixteen transients using a 1.00 s relaxation delay were added with 822 complex data.
The optimal one-bond and n-bond heteronuclear coupling constants for HSQC and HMBC were 146 and 8 Hz, respectively. The ranges were set as –0.5–10.0 ppm in the F2 dimension and 0–200 ppm in the F1 dimension, respectively.
2.5. Multivariate statistical analysis of NMR spectroscopic dataset
The 1H NMR spectra were processed using MestReNova software (version 5.2.5, Mestrelab Research, Santiago de Compostella, Spain). Each spectrum was scaled to the total intensity and reduced to integrated regions of equal width (0.02 ppm) among the region of δ 0.50–9.50 after excluding the regions of δ 4.70–
5.02 and δ 3.26–3.36 to omit the residual signals of water and methanol, respectively. Principal component analysis (PCA) with Pareto (Par) scaling as well as orthogonal partial least squares- discriminant analysis (OPLS-DA) with unit variance (UV) scaling were performed with SIMCA-P 12.0 software (Umetrics, Umeå, Sweden).
2.6. Simultaneous determination of echinacoside and acteoside using HPLC-UV
To cross-validate the findings for the three processing techniques, an Agilent 1260 series HPLC system consisting of a degasser, a quaternary pump, an autosampler, a column oven, and a diode array detector (Agilent Technologies, Santa Clara, CA, USA) were employed for the simultaneous determination of echinacoside and acteoside in all a-, b- and c-type samples. An Agilent Zorbax SB- C18 column (250 mm×4.6 mm, particle size 5 μm, Agilent Technologies) protected by the corresponding guard column (10 mm×4.6 mm, particle size 5 μm) was selected to conduct chromatographic separations. The sample preparation protocol, mobile phase, and elution program followed the descriptions archived in Chinese Pharmacopeia (2010 Edition)3 with minor modifications. In brief, ultrasonic-assisted extraction was performed for 30 min using 50% aqueous methanol; 30% aqueous methanol was adopted as the mobile phase for isocratic elution at a flow rate of 1.0 mL/min, and the column oven was maintained at
30 °C. The detection wavelength was set at 330 nm, and the injection volume was set as 10 μL.

3. Results and discussion
3.1. Optimization of extraction and spectroscopic parameters
To obtain high-quality 1H NMR spectra for all samples, various parameters were carefully optimized using a representative sample (CD1-GUI). Firstly, extraction solvent was selected among 30% aqueous methanol, 50% aqueous methanol, and methanol. The results indicated that a greater overall response was afforded by 50% aqueous methanol over the other two ones, agreeing well with the extraction protocol authenticated in Chinese Pharmacopeia (2015 edition)3. Ultrasonic-assisted extraction was chosen owing to its convenient operation at yields comparable to those of hot-reflux extraction and Soxhlet extraction (data not shown). Afterward, ultrasonic-assisted duration was compared between 40 and 60 min, and 60 min ultrasonic water bathing did not exhibit greater extraction potency than 40 min; hence, 40 min was set for the ultrasonic apparatus for time-saving consideration.
On the other hand, 0.5 mL of CD3OD–phosphate buffer in D2O (1:1, pH 7.4) was compared with 0.5 mL of CD3OD–D2O (1:1), and the results showed that the fortification with phosphate buffer could prevent the spectral profile from variation and migration. A 2.0 mL aliquot of the extract was successively concentrated, reconstituted, and subjected to NMR analysis to afford appropriate response for most signals. Furthermore, the wet method was observed to be better than a presaturation program for reducing the peak intensity of the residual water (around δ 4.8) in the spectrum. We also found that the increment of the scanning number was beneficial for the improvement of signal-noise ratio (S/N) which was quite helpful for sensitive detection (in particular for those of trace components). However, since this approach was harmful to quick measurement, 256 scans were ultimately applied for each 1H NMR assay to achieve acceptable sensitivity.
3.2. Signal assignment of 1H NMR spectrum
The identification of chemical components in CD was achieved by jointly analyzing 1H NMR, 13C NMR, and 2D NMR spectra (Fig. 1 and Supplementary information Figs. S1–S10) and comparing with samples of authentic compounds, as well as by referring to accessible databases, such as MMCD . The plausible assignments of the signals in 1H NMR are given in Fig. 1. Chemical shift values for the putative identities are summarized in Table S2 (Supplemental information).
The structural characteristics of PhGs in the genus Cistanche have been described in literature1. Because of the great structural similarity among PhGs, e.g., echinacoside vs. acteoside, the proton signals of the phenylethanoid moieties extensively overlapped each other in 1H NMR spectrum. This overlap posed a challenging analytical problem to reliably discriminate between these signals. In the current study, the signals belonging to echinacoside and acteoside, which are the primary ingredients in original plant, were unambiguously assigned with the assistance of reference compounds and diverse NMR spectra (Table S2, Fig. 1 and Figs. S1–S6). The diagnostic signal at δ 7.73 (d, J 16.0 Hz) indicated the distribution of Castano-
side B/D or other feruloyl substituted PhGs (Table S2 and Fig. 1)22. Moreover, cis-type PhGs (cis-type coumaroyl or caffeoyl substituted PhGs) were also observed in the extract based on the presence of δ 6.95 (d, J 12.0 Hz) in the spectrum (Table S2 and Fig. 1).
Several obvious signals were detected in the region of δ 8.0–9.5. The signals at δ 9.15, 8.88, and 8.09 were tentatively assigned to nicotinamide (Table S2 and Fig. 1), and 13C NMR as well as 2D

NMR spectra (Figs. S4–S6) also supported this assignment. The signal at δ 8.48 was plausibly assigned to formic acid, whereas the signals at δ 8.13 and 8.11 were generated from adenosine and adenine, respectively (Table S2 and Fig. 1). The carbohydrate signals are usually located at the region between δ 3.00 and 5.50. Obviously, sucrose was the most abundant disaccharide in CD, exhibiting significant resonances at δ 4.04, 4.18, and 5.41 (Table S2 and Figs. 1 and S7). Obvious signals belonging to the anomeric protons of β-galactose, α-glucose, and β-glucose were resonated at δ 5.24, 5.20, and 4.60, respectively (Table S2, Figs. 1 and S8, S9). The occurrence of mannitol was disclosed by the observation of the signal at δ 4.00 as well as by comparing with the reference compound (Table S2, Figs. 1 and S10). The diagnostic signal of 1-O-ethyl-glucoside was observed at 1.16 ppm by referring to HMDB. Amino acids, including leucine (0.93 ppm), isoleucine/valine (0.98 ppm), threonine (1.27 ppm), alanine (1.49 ppm), lysine (1.71 ppm), glutamine (2.30 ppm), asparagine acid (2.96 ppm), proline (4.09 ppm), tyrosine (7.12 ppm), and phenylalanine (7.33 ppm) were tentatively assigned via comparing their respective diagnostic spectroscopic behaviors with those archived in HMDB (Table S2 and Fig. 1). Iridoids and lignans were aforementioned as the important chemical homologs in CD. In the representative 1 H NMR spectrum (Fig. 1), the signals of syringaresinol (a lignan derivative), and 8-epiloganic acid (an iridoid derivative) were observed at δ 7.02 and 0.98, respectively. Moreover, the multiplet signals ranged from δ 6.56–6.64 could be tentatively assigned to citrus A, alaschanioside A, or dehydeodiconiferyl alcohol glucoside (all lignan derivatives), while the signals among δ 6.18–6.33 might also be generated by iridoids (Table S2 and Fig. 1). Moreover, the occurrences of some aliphatic carboxylic acids in CD, including fumaric acid, maleic acid, malic acid, isocitric acid, citric acid, ketoglutaric acid, pyruvic acid, succinic acid, acetic acid, and another fatty acid, were tentatively characterized by the observation of the diagnostic signals at δ 6.54, 6.02, 4.27, 3.04, 2.73, 2.52, 2.49, 2.42, 1.97, and 1.33, sequentially (Table S2 and Fig. 1). Additionally, some signals, such as a multiplet signal around 3.80 ppm and a singlet at 1.97 ppm22, were regarded as the characteristics for the methoxy and acetyl groups (Table S2 and Fig. 1), respectively, which are the common substitutes of phenyl derivatives, especially PhGs in this case. Meanwhile, the signal at 1.06 ppm could be tentatively assigned to the rhamnose residue. It is well known that 1 H NMR spectroscopy can provide direct quantitative information because the intensity of the proton signal is proportional to the molar concentration of the analyte19. Hence, the preliminary quantitative comparison could be performed for the ingredients in CD. Obviously, the carbohydrates, in particular sucrose, yielded the highest responses in the representative spectrum (Fig. 1). As a holoparasitic plant that grows underground within almost a whole life cycle, photosynthesis is not necessary and not available for CD; therefore, it is not surprising that no photosynthesis-involved primary metabolite, such as the Kelvin cycle (also known as C3 cycle) participant, was found in the spectrum23. On the contrary, a wealth of molecules participating in the tricarboxylic acid cycle (TCA cycle, also known as citric acid cycle and Krebs cycle) was detected, such as citric acid, ketoglutaric acid, pyruvic acid, and succinic acid, indicating that vigorous central carbon metabolism (CCM) occurs in the original plant. On the other hand, PhGs were observed as the dominant chemical family among various secondary metabolites, while lignans and iridoids merely provided minor contributions for the entire spectral profile.
3.3. Precision assay of 1H NMR spectroscopy
The spectroscopic precision plays a key role in the reliability of metabolomics characterization. In the current study, the precision of the whole methodology was assayed by preparing a representative sample (CD1-GUI) in quintuplicate and subsequently analyzing it in two consecutive days. The obtained spectra exhibited great overall similarity by overlaying all spectra, suggesting that the sample preparation protocol and 1H NMR measurement was reproducible and the sample could keep stable in two days at least.

3.4. Discrimination of the upper and the lower plant parts
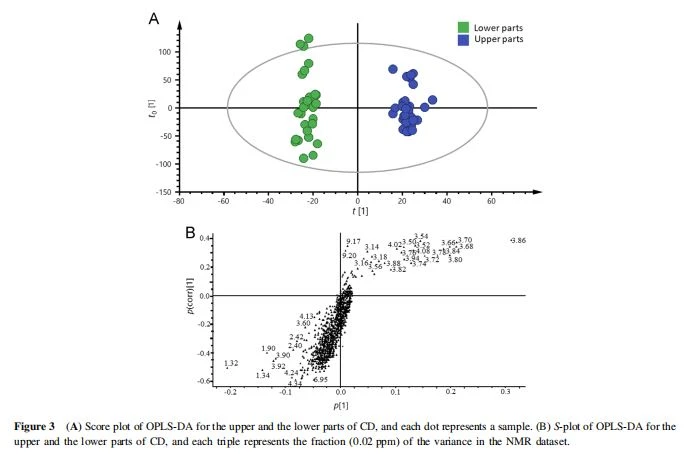
Until now, no evidence has demonstrated that the upper parts of CD are equivalent to the lower parts regarding the chemical profile and pharmacological properties. Aiming to clarify whether the accumulation of primary or secondary metabolites occurred in certain parts of CD, the entire succulent stems were cut into the upper and the lower parts, both of which were subsequently processed, extracted, and measured using 1 H NMR spectroscopy. Fig. 2 exhibits the representative spectra of both parts. Overall, most signals in the lower parts were higher than those in the upper parts. In the range of δ 6.0–9.5, no unique signal could be found in either part; however, the overall intensity of those signals in the lower parts was slightly higher than those in the upper parts, suggesting that the aromatic derivatives could be enriched in the domain near the parasitic point23. The lower parts were also rich in fatty acids, certain amino acids, and some other energy storage substances because the overall signal response of the aliphatic region (δ 0.5–3.0) in the lower parts was higher than that of the upper parts. Moreover, some obvious differences could be observed within the sugar region (δ 3.0–5.0), and most of the signals located in the range of δ 3.0–5.0 for the upper parts were higher than those in the lower parts, indicating that the carbohydrates, notable oligosaccharides, could be accumulated in the upper parts. In order to highlight the differences between the upper parts and the lower parts and also to identify the primary contributors in charge of their discrimination, multivariate data analysis was applied to process the spectroscopic dataset of the different parts. An unsupervised approach named PCA, which only uses the information from one matrix, was initially applied in order to classify all samples according to characteristic 1 H NMR spectra. However, extensive overlap occurred for these two different parts (data not shown). Afterward, OPLS-DA, a supervised approach, was launched to sharpen the separation between different groups as well as to understand the variables carrying the class separation information. OPLS-DA achieved a good separation for the different parts of CD. Fig. 3A and B show the score plot and S-plot of OPLS-DA, respectively. Both the overall goodness of fit (R2Y¼0.910) and the overall cross-validation coefficient (Q2Y¼0.981) were close to 1.0. Therefore, the original separation model was statistically sound with high predictability. Obviously, the upper parts could be distinguished from the lower parts when the samples were tagged with two groups, and the S-plot gave the signals that potentially contributed to the differentiation. Overall, more dots were distributed in the region corresponding to the lower parts in the S-plot, where higher contents of fatty acids (δ 1.32–1.35) and TCA cycle factors (such as succinic acid at δ 2.42) were distributed; however, the upper part (right cluster in Fig. 3A) were rich in some carbohydrates (mainly δ 3.70–4.10, Fig. 3B). The potential biomarkers provided by the S-plot were strongly consistent with the comparison of the spectra of the two parts by direct observation and overlaying. It is well defined that metabolites are synthesized in tissue-, organ and developmental-specific ways by specific biosynthesis enzymes and then stored, sometimes in high contents in the producing domains, corresponding to their diverse functions for the whole plant. For instance, both of the types and contents of ginsenosides exhibit significant variations among the rhizomes, roots, leaves, and followers of Panax notoginseng24. Regarding CD, from the qualitative viewpoint, the secondary metabolite profiles exhibited high similarity between the upper parts and the lower parts. Because the lower parts of the whole plants act as the role for transmitting nutrient substances, most of which are primary metabolites, e.g., carbohydrates, from the host, Haloxylon ammodendron to the vigorous metabolism points, indicating that more abundant primary metabolites should occur in the lower parts. Moreover, extensive hydrolysis of polysaccharides to oligosaccharides and subsequently to monosaccharides, which could be finally bio-transferred into some aliphatic carboxylic acids, should extensively occur at the upper parts. Because 50% aqueous methanol was utilized for extraction in this study and it was capable of extracting hydrophilic low molecules instead of macromolecules (e.g. polysaccharides), it is not surprising to note that the accumulation of TCA cycle factors and fatty acids were demonstrated in the lower parts. However, some oligosaccharides, the hydrolytic products of polysaccharides, were found to be enriched in the upper parts. On the other hand, minor differences were observed for PhGs between different parts from the quantitative viewpoint, and overall, a slight accumulation of PhGs was observed at the lower parts23,25. It was reported that haustorium phloem is probably the secondary synthetic organ for PhGs in CD23; hence, the lower parts, which are near to the parasitic point, should be wealthy of PhGs.
3.5. Proposal of a new processing method for CD
Obviously, the medicinal slices belonging to c-type samples were superior in terms of good appearance, off-white color, light, and crisp texture. Fig. 4 shows the representative 1 H NMR spectra for those three types of samples. Following parallel measurements, however, different spectral profiles were obtained for those processed medicinal slices. Through direct observation and overlaying, obvious differences could be observed. Firstly, in the region of δ 6.00–8.00, where mainly included the signals belonging to PhGs and some other phenolic derivatives, the responses of c-type samples (Fig. 4C) were quite higher than the other two types. Secondly, the responses of most carbohydrates and TCA participants in b-type samples (Fig. 4B) were almost equivalent to those in c-type samples (Fig. 4C) but much higher than those in a-type samples (Fig. 4A). Thirdly, the contents of glucose (δ 5.20 for α-glucose, and δ 4.60 for β-glucose) in b-type samples (Fig. 4B) were slightly higher than those in c-type samples (Fig. 4C). Finally, more fatty acids were detected in the a-and c-type samples than in b-type samples (Fig. 4). Above all, the most abundant phenol derivatives, such as this, which have been widely regarded as the effective ingredients in CD, were found in the samples processed by a new method (c-type samples), in comparison of a-and b-type samples. Moreover, abundant primary metabolites, such as carbohydrates, TCA participants, and fatty acids were also found in c-type samples. Subsequently, the comparisons of all samples through multi-variate data analysis were carried out aiming to highlight the similarities as well as differences among those three types of medicinal slices. PCA with Par scaling and OPLS-DA with UV scaling was performed to process the NMR spectroscopic dataset, successively (data not shown). Significant separation was not achieved using PCA; however, the score plots of OPLS-DA for these three groups (green, blue, and red dots in Fig. 5A) showed clear classification, indicating that these three sample groups were significantly different regarding their metabolic profiles. The

degradation of the PhGs initiated by either the enzymes in the original plant or high-temperature storage. As a consequence, the processed slices (c-type samples) using the new method were advantageous at both pleasant appearance and higher effective compound contents. To cross-validate the results aforementioned for the three processing techniques, the HPLC–UV method that was well-developed and authenticated in Chinese Pharmacopeia (2015 edition)3 was utilized to simultaneously determine the contents of echinacoside and acteoside, which played important roles to distinguish the above three types of processed products. The mean contents of echinacoside in a-, b-, and c-type samples were 8.33, 4.10, and 16.19 mg/g, respectively, while the acteoside contents were 1.57, 1.14, and 3.66 mg/g, respectively. Obviously, the PhGs contents in the c-type materials were 2–4 folds higher than those in a-and b-type samples, agreeing well with the 1 H NMR-based metabolomics results. Among the available analytical techniques generally employed in metabolomics studies, NMR and MS-based methods have been usually acknowledged to be favorable alternatives. NMR spectroscopy, in particular 1 H NMR, possesses unsurpassed superiorities over other techniques, such as non-selectivity, convenient sample preparation, and the ease of simultaneous detection of diverse groups of metabolites in a relatively short measuring time. Hitherto, 1 H NMR-based metabolomics has been utilized to authenticate plants17 to compare analog herbs18, to differentiate habitat26, and to characterize the degradation of herbs26. Herein, 1 H NMR was applied to distinguish the different parts of CD, and also to propose a new process workflow, indicating 1 H NMR spectroscopy is a flexible and robust analytical tool to offer meaningful guidelines for the exploitation of CD as well as some other herbal medicines by providing comprehensive qualitative and quantitative information of complicated extract matrices.