Quality Markers Of Cistanches Herba Based On Antioxidant Spectrum-Effect Relationship
Mar 27, 2024
Abstract: Objective: To establish a research method for the quality markers (Q-markers) of Cistanches Herba (CH) based on the antioxidant spectrum-effect relationship, providing a basis for the study of its pharmacological substances and quality control. Methods: Ultra-high-performance liquid chromatography (UPLC) was used to establish fingerprint profiles for 10 batches of CH. A cell oxidative damage model was established using H2O2, and the antioxidant capacity of CH was determined based on the half-maximal inhibitory concentration of reactive oxygen species, as well as the levels of superoxide dismutase and catalase as pharmacological indicators. The spectrum-effect relationship was constructed through principal component analysis, Pearson correlation analysis, and partial least squares regression analysis. The active components were subjected to pharmacological validation.
Results: Fingerprint profiles for CH were established using UPLC, identifying 17 common peaks. Based on spectrum-effect correlation analysis, nine components were selected. The pharmacological validation results indicated that geniposidic acid, 8-epiloganic acid, echinacoside, acteoside, isoacteoside, and tubuloside Aexhibited antioxidant activity in a concentration-dependent manner.
Conclusion: This study explored Q-markers for CH based on the spectrum-effect relationship, providing reference information for its pharmacological substance foundation and quality standard improvement.
Keywords:Cistanches Herba; Q-marker; spectrum-effect relationship; antioxidant

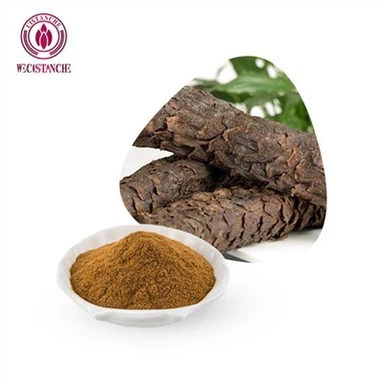
Cistanche deserticola is the dried fleshy stem with scaly leaves of Cistanche deserticola Y.C.Ma or Cistanche tubulosa (Schenk) Wight, a plant belonging to the Cistanche deserticola family orbaceae. It is warm in nature, sweet and salty in taste; it returns to the kidney and large intestine meridians; it has the effects of nourishing kidney yang, replenishing essence and blood, moistening the intestines and laxative, and is an important medicine for tonifying the kidney and replenishing essence [2-3]. The kidneys store essence, and essence and blood come from the same source. If essence and blood are deficient, it will affect the overall life activities of the human body; the essence-producing marrow is stored in the bones, and the brain is the marrow sea. If the kidney essence is insufficient, the bones will lose their nourishment and the brain will be deficient, resulting in bone Degenerative changes such as loose texture, tooth loss, memory loss, dementia, and decreased immune function [4-6]. Cistanche deserticola contains phenylethanoid glycosides, iridoids, lignans and other structural components, including echinacoside, verbascoside, verbascoside, genipinic acid, and 8-epistryanic acid. , tubulin A, etc. [7]. The current quality control of Cistanche deserticola in the 2020 edition of the "Pharmacopoeia of the People's Republic of China" only stipulates the content of echinacoside and verbascoside, which cannot fully reflect the multi-component and multi-target action characteristics of traditional Chinese medicine. , which is not conducive to its quality control and evaluation.


In order to improve the quality control level of traditional Chinese medicine and optimize the quality evaluation of traditional Chinese medicine, Academician Liu Changxiao proposed the new concept of quality marker (Q-marker) of traditional Chinese medicine [8]. Among them, "effectiveness" is the core element in the "Five Principles" of Q-marker [9] and is also the core of the quality evaluation of traditional Chinese medicines.
In view of the current research status of poor correlation between quality standards and drug efficacy, exploring Q-markers of traditional Chinese medicines and establishing more scientific and reasonable quality standards is of great significance to improving the quality of traditional Chinese medicines. The spectrum-effect relationship links the fingerprint chromatographic peaks of traditional Chinese medicine with specific pharmacodynamic data to find the effective substances of traditional Chinese medicine, thereby reflecting the inherent quality of traditional Chinese medicine [10]. The establishment of a spectral efficiency mathematical model can clarify the QMarker of traditional Chinese medicine from a "holistic view" perspective, providing more reference for later quality control of traditional Chinese medicine, formulation of quality standards, and screening of active ingredients. This study uses fingerprints combined with the half-inhibition rate of reactive oxygen species (ROS IC50), the contents of superoxide dismutase (SOD) and catalase (CAT) to study the spectrum-effect relationship of traditional Chinese medicine, and uses principal component analysis (PCA) ), Pearson correlation analysis (PCC) and partial least squares regression analysis (PLS) to comprehensively analyze the Q-marker of Cistanche deserticola to provide a basis for its quality control.
1 material
1.1 Sample
Cistanche deserticola was harvested from Yutian County, Xinjiang, and the Cistanche deserticola Good Agricultural Practice (GAP) planting base in Inner Mongolia. It was identified by researcher Zhang Tiejun of Tianjin Pharmaceutical Research Institute Co., Ltd. as Cistanche tubulosa (Schenk) Wight and Cistanche deserticola.
Y. C. Ma, detailed information is shown in Table 1.

1.2 Test medicine
Echinaceaside (batch number: 111670-201907, purity: 91.8%) and verbascoside (batch number: 111530-201914, purity: 95.2%) were both purchased from China Institute of Food and Drug Control; isorescoside (batch number: 61303-13 -7), salidroside (batch number: 10338-51-9), 8-epistrychnoic acid (batch number: 82509-41-9), genipinic acid (batch number: Z24A10X95926), tuberose B (Batch number: 112516-04-08), 2-acetyl eugenol glycoside (Batch number: 94492-24-7) were purchased from Shanghai Yuanye Biotechnology Co., Ltd., purity ≥98%; Cistanche glycoside A (Batch number: MUST -20062806, purity: 98.51%), floridin A (batch number: MUST19110102, purity: 98.57%) were purchased from Chengdu Mansite Biotechnology Co., Ltd.; chromatographically pure acetonitrile and formic acid were purchased from Tianjin Concord Technology Co., Ltd. Company; Purified Water (Hangzhou Wahaha Group Co., Ltd.). Vitamin E (VE, V8010, Beijing Solarbio Company); dimethyl sulfoxide (DMSO, D2660-100ML, Sigma Company of the United States); CellTiter 96® AQueous single solution cell proliferation detection kit (G3580, Promega Company of the United States); CAT detection The kit (S0051), SOD activity detection kit (S0101M), and ROS detection kit (S0033S) were purchased from Shanghai Biyuntian Biotechnology Co., Ltd.
1.3 Instruments
Waters H-class-PDA ultra-high performance liquid chromatograph (Waters Company, USA); Sartorius BT25S electronic balance (Sartorius Company, Germany); H1650 high-speed desktop centrifuge (Hunan Xiangyi Laboratory Instrument Development Co., Ltd.); SpectraMax M5
Microplate reader (Meigu Molecular Instrument Co., Ltd.); WYS-41XDY biological microscope (Tianjin Micro-Instrument Optical Instrument Co., Ltd.).

1.4 cells
Human embryonic kidney cells HEK 293 cells were used in this experiment and were purchased from the cell bank of the Chinese Academy of Sciences.
2 methods
2.1 Establishment of fingerprint map
2.1.1 Preparation of test solution: Weigh 2 g of Cistanche deserticola medicinal material, add 10 times the amount of water, heat and reflux 3 times, 1 h each time, centrifuge at 1.0×10⁵r·min-1 for 15 min (centrifugal radius is 300 mm), Combine the supernatants and concentrate to make a stock solution with a mass concentration of 100 mg·mL-1, dilute it 10 times, and filter it through a 0.22 µm microporous filter membrane to obtain it.
2.1.2 Preparation of mixed reference solution
Take 8-epistrrychnic acid, salidroside, echinaceaside, cistanche glycoside A, genipinic acid, verbascoside, anthocyanoside A, isorbascoside, and 2'-acetyl eugenol. Glycoside and angioside B reference substances were measured in appropriate amounts and weighed accurately. Add 50% methanol solution to dissolve and prepare a mixed reference substance solution with a mass concentration of 20 µg·mL–1.
2.1.3 Chromatographic conditions
ACQUITY UPLC®BEH C18 column (100 mm × 2.1 mm, 1.7 µm); mobile phase is acetonitrile (A) ~ 0.1% formic acid solution (B), gradient elution program (0 ~ 6 min, 5% ~ 8% A; 6~10 min, 8%~15%A; 10~13 min, 15%~19%A, 13~20 min, 19%~25%A); detection wavelength is 237 nm; flow rate is 0.4 mL·min –1; column temperature is 40 °C; injection volume is 3 µL.

2.1.4 Reference peak selection
In the ultra-performance liquid chromatography (UPLC) chromatogram of Cistanche deserticola, the peak with the largest peak area ratio, moderate retention time, and good separation was selected as the reference peak of the fingerprint spectrum. 2.1.5 Methodological investigation Precision test: Take the T1 sample and prepare the test solution according to the method under 2.1.1. Inject the sample 6 times continuously and record the fingerprint. The results show that the relative peak area RSD of each peak is 0.10%~4.61%. , the RSD of the relative retention time is 0.08%~1.32%, indicating that the instrument has good precision.
Repeatability test: Take the T1 sample and prepare 6 samples of the test solution in parallel according to the method under 2.1.1, and inject the sample continuously. The results show that the relative peak area RSD of each chromatographic peak is 1.35%~4.80%, and the relative retention time RSD is 0.10%~1.80%, which meets the requirements of the fingerprint and shows that the repeatability of the instrument is good.
Stability test: Take the T1 sample and prepare the test solution according to the method under 2.1.1, inject samples for testing at 0, 2, 4, 8, and 12 hours, and record the fingerprint. The calculated RSD of the relative peak area of each chromatographic peak is 0.53%~4.82%, and the RSD of the relative retention time is 0.09%~2.17%, which meets the requirements of the fingerprint and indicates that the test product is stable within 12 hours.
2.2 Research on the antioxidant effect of Cistanche deserticola
2.2.1 Preparation of Cistanche deserticola mother liquor: Take the mother liquor under item 2.1.1, filter and sterilize, and dilute it with culture medium to the required concentration before use.
2.2.2 Effects of Cistanche deserticola and positive control VE on the viability of HEK 293 cells
Set up the normal group (cell suspension), Cistanche deserticola administration group (25, 50, 100, 200, 400 µg·mL–1), VE group (20, 40, 60, 80, 100 µmol·L–1), each Set 6 duplicate wells at each concentration and culture for 24 hours. Add 20 µL of CellTiter 96® AQueous single solution reagent to each well to detect cell viability. Continue culturing for 2 hours. Use a microplate reader to detect the absorbance (OD) value of each well at 490 nm. Calculate cell survival rate according to formula (1). Survival rate (%) = (OD experimental group/OD blank group) × 100% (1)
2.2.3 Effect of Cistanche deserticola on ROS induced by H2O2 in HEK 293 cells
The cells were divided into normal group (cell suspension) and Cistanche deserticola administration group (6.25, 12.5, 25, 50, 100 µg·mL–1 Cistanche deserticola and 60 µm·L–1 H2O2), and cultured for 24 h. Follow the steps of the ROS detection kit for subsequent operations, directly observe the cell staining through a microscope, and use a microplate reader to detect the fluorescence intensity of each group. Parameter settings used an excitation wavelength of 488 nm and an emission wavelength of 525 nm. The experiment was repeated three times.

2.2.4 Effect of Cistanche deserticola on H2O2-induced SOD of HEK 293 cells
Divide cells into normal group (cell suspension) and model group
(60 µm·L–1 H2O2), VE group (60 µm·L–1 VE and 60 µm·L–1 H2O2), Cistanche deserticola administration group (100 µg·mL–1 Cistanche deserticola and 60 µm·L–1 H2O2 ), collect the cells after 24 h of culture, add SOD sample preparation solution to lyse the cells, centrifuge at 4°C, 12000 r·min-1 for 5 min (centrifugal radius is 300 mm), take the supernatant as the sample to be tested, follow the SOD detection kit Follow the steps below. The experiment was repeated three times.
2.2.5 Effect of Cistanche deserticola on H2O2-induced CAT in HEK 293 cells
Follow the method under 2.2.4 and group administration, add lysis solution, centrifuge at 4°C, 12000 r·min-1 for 10 minutes (centrifuge radius is 300 mm), take the supernatant, and follow the steps of the CAT detection kit. Follow-up operations. The experiment was repeated three times.
2.2.6 Statistical analysis
SPSS 26.0 software was used for statistical analysis. Each group of data was represented by (±±(). One-way analysis of variance was performed on the data that conformed to the normal distribution. If the variances were equal, the least Least-Significant Difference method was used. If the variances were uneven, Dunnett's T3 method was used. GraphPad Prism 8 was used for graphing, and P<0.05 was considered as a statistically significant difference.
2.3 Spectrum-effect correlation analysis of Cistanche deserticola antioxidant
2.3.1 PCA The peak areas of the common peaks of 10 batches of Cistanche deserticola that have established fingerprints were standardized by Z value, and made into a 10 × 17 order data matrix, which was imported into SPSS 26.0 software for PCA.
2.3.2 PCC Use SPSS 26.0 to conduct bivariate analysis to study the spectral efficiency relationship between Cistanche deserticola fingerprints and antioxidants.
Significance testing uses a two-sided test (T) with P<0.05 as the standard for statistically significant differences.
2.3.3 PLS Import the experimental results of Cistanche deserticola's standardized peak area and antioxidant into SIMCA-P 14.1 software, set the peak area as the X variable, and set the pharmacodynamic index as the Y variable to perform PLS.
2.4 Cistanche deserticola Q-marker antioxidant activity verification
2.4.1 Preparation of active ingredient mother liquor
Accurately weigh appropriate amounts of genipinic acid, 8-epistrichnic acid, echinaceaside, verbascoside, isorebascoside, and anthocyanoside A, and add DMSO to dissolve them into 10 mmol·L–1 for control. product solution.
2.4.2 Effect of active ingredients on HEK 293 cytotoxicity
After HEK 293 cells were incubated for 24 hours, 100 µL of active ingredient solutions under item 2.4.1 (0.781, 1.563, 3.125, 6.25, 12.5, 25, 50, 100 µmol·L–1) of different concentrations were added to each well, and stimulation was continued. CellTiter 96® AQueous single solution reagent was added to the cells 24 hours later to detect cell viability.
2.4.3 The antioxidant effect of active ingredients on H2O2-induced HEK 293 cells
Cells were grouped as follows: normal group, model group, VE group were grouped as in 2.2.4, experimental group (0.781, 1.563, 3.125 µm·L–1 active ingredient and 60 µm·L–1 H2O2), cultured for 24 h. Determine intracellular ROS levels, SOD and CAT enzyme contents according to the methods under 2.2.3, 2.2.4 and 2.2.5 respectively.
Supportive Service Of Wecistanche
Email:wallence.suen@wecistanche.com
Whatsapp/Tel:+86 15292862950
Shop For More Specifications Details:
https://www.xjcistanche.com/cistanche-shop