From Cistanche To Oral Beauty Drinks: A Natural Herbal Formulation Strategy For Skin Health, Anti-Glycation And Beauty-From-Within Products
Nov 04, 2026
Meta description:
Explore a natural herbal oral beauty drink formula based on fermented Cistanche, Eucommia leaf, Cornus officinalis and Gastrodia. Includes formulation logic, extraction technologies, in vitro data, animal data and a 28-day human use study.
Why Oral Beauty Drinks Need More Than "Just Collagen"
The beauty-from-within market is moving beyond simple collagen drinks. Consumers now expect oral beauty products to support skin health from multiple angles, including:
anti-glycation support;
antioxidant protection;
collagen synthesis;
skin barrier hydration;
skin elasticity and firmness;
visible improvement in dullness and fine lines.
For manufacturers developing natural herbal oral liquids, the key question is no longer whether to use botanicals, but how to extract, combine and validate them properly.
This article introduces a botanical oral beauty formula built around Eucommia leaf, fermented Cistanche, Cornus officinalis and Gastrodia, combined with Type III collagen peptides and vitamin C. The formula was designed to support skin health through anti-glycation, antioxidant, collagen-supporting and barrier-enhancing pathways.
1. Core Botanical Formula
The botanical extract complex contains four herbal ingredients:
| Ingredient | Suggested Range, Parts by Weight | Key Role in the Formula |
|---|---|---|
| Eucommia ulmoides leaf extract powder | 40–60 | Anti-glycation, antioxidant, collagen-supporting activity |
| Cistanche deserticola extract powder | 25–35 | Fermented herbal support for antioxidant activity, amino acid supply and skin vitality |
| Cornus officinalis fruit extract powder | 15–25 | Iridoid glycosides, polysaccharides, anti-glycation and barrier-supporting activity |
| Gastrodia elata extract powder | 8–12 | Antioxidant and skin-soothing support |
For a finished oral liquid, the botanical complex can be combined with:
| Component | Suggested Range, Parts by Weight |
|---|---|
| Botanical extract complex | 40–60 |
| Type III collagen peptide powder | 40–60 |
| Fructooligosaccharides | 25–35 |
| Hydroxypropyl-β-cyclodextrin | 20–30 |
| Maltodextrin | 70–80 |
| Steviol glycosides | 0.5–2 |
| Citric acid | 1–5 |
| Vitamin C | 0.01–0.5 |
| Xanthan gum | 1–3 |
This structure is practical for oral beauty drink development because it combines:
herbal active compounds;
collagen peptide nutrition;
vitamin C as a collagen-supporting cofactor;
prebiotic support from fructooligosaccharides;
taste-masking and solubility support from hydroxypropyl-β-cyclodextrin;
texture and suspension stability from xanthan gum.
2. Why Processing Technology Matters
A major problem with many herbal oral beauty products is not the choice of herbs, but the extraction method. Traditional water or ethanol extraction may lead to low yield, poor selectivity, unpleasant taste and unstable active compounds.
This formulation uses four different processing routes:
2.1 Eucommia Leaf: Deep Eutectic Solvent Extraction
Eucommia leaf is extracted using a deep eutectic solvent system based on choline chloride and glycerol, followed by ultrasonic extraction and macroporous resin purification.
This approach is designed to enrich compounds such as:
geniposidic acid;
flavonoids;
polyphenols.
These compounds are associated with anti-glycation and antioxidant effects.
2.2 Cistanche: Microbial Fermentation
Cistanche deserticola is processed through anaerobic fermentation using a probiotic strain combination:
Bifidobacterium animalis subsp. lactis BL-99;
Lactobacillus delbrueckii subsp. bulgaricus Ouya-D-L5.
Fermentation may help transform glycosides, increase the availability of active metabolites, improve the sensory profile and reduce the characteristic herbal off-notes of Cistanche.
For a Cistanche factory developing oral beauty drinks, this is an important point: fermented Cistanche can be positioned not only as a traditional tonic ingredient, but also as a modern beauty-from-within botanical material.
2.3 Cornus officinalis: Nanofiltration Plus Subcritical Water Extraction
Cornus officinalis fruit is processed by separating juice and pomace. The juice is concentrated by nanofiltration, while the pomace is extracted using subcritical water.
This dual process helps recover both water-soluble and matrix-bound active components, including iridoid glycosides and polysaccharides.
2.4 Gastrodia: Ethanol Reflux Extraction
Gastrodia elata is extracted with aqueous ethanol by reflux extraction. This helps obtain antioxidant and phenolic compounds that may support skin protection and anti-dullness benefits.

3. In Vitro Evidence: Anti-Glycation, Antioxidant and Brightening-Related Activity
The herbal complex was evaluated in several in vitro assays, including:
AGEs inhibition assay;
DPPH free radical scavenging assay;
ABTS free radical scavenging assay;
tyrosinase inhibition assay.
Table 1. Reagent Dosage for the AGEs Inhibition Assay
| Group | PBS, µL | BSA Solution, µL | Glucose Solution, µL | Test Solution, µL | Final Volume, µL |
|---|---|---|---|---|---|
| Blank group | 300 | 400 | 0 | 0 | 700 |
| Sample group | 0 | 400 | 100 | 200 | 700 |
| Positive control group | 0 | 400 | 100 | 200 | 700 |
Note: In the positive control group, the test solution was aminoguanidine solution.
Table 2. AGEs Inhibition Rate of Different Samples
| Group | AGEs Inhibition Rate, % |
|---|---|
| Positive control group | 93.03 |
| Example 1 | 91.57 |
| Example 2 | 90.94 |
| Example 3 | 90.21 |
| Comparative Example 1 | 74.78 |
| Comparative Example 2 | 78.32 |
| Comparative Example 3 | 79.60 |
| Comparative Example 4 | 81.85 |
| Comparative Example 5 | 67.19 |
| Comparative Example 6 | 65.46 |
The optimized examples showed AGEs inhibition rates above 90%, close to the positive control. This suggests that the four-herb combination and optimized extraction processes are important for anti-glycation performance.
Table 3. DPPH and ABTS Free Radical Scavenging Rates
| Group | DPPH Scavenging Rate, % | ABTS Free Radical Scavenging Rate, % |
|---|---|---|
| Example 1 | 85.45 | 93.22 |
| Example 2 | 83.63 | 92.54 |
| Example 3 | 84.21 | 92.80 |
| Comparative Example 1 | 70.87 | 75.46 |
| Comparative Example 2 | 72.09 | 78.13 |
| Comparative Example 3 | 75.56 | 80.69 |
| Comparative Example 4 | 77.72 | 83.05 |
| Comparative Example 5 | 58.18 | 64.77 |
| Comparative Example 6 | 60.34 | 69.31 |
The optimized herbal complexes showed stronger antioxidant activity than the comparative formulas. This supports the idea that ingredient synergy and processing method both influence antioxidant capacity.
Table 4. Reagent Dosage for the Tyrosinase Inhibition Assay
| Group | PBS, µL | Tyrosinase Solution, µL | L-DOPA Solution, µL | Sample Solution, µL | Final Volume, µL |
|---|---|---|---|---|---|
| Blank group | 80 | 0 | 80 | 40 | 200 |
| Sample group | 40 | 40 | 80 | 40 | 200 |
Table 5. Tyrosinase Inhibition Rate of Different Samples
| Group | Tyrosinase Inhibition Rate, % |
|---|---|
| Example 1 | 78.52 |
| Example 2 | 77.96 |
| Example 3 | 78.25 |
| Comparative Example 1 | 58.68 |
| Comparative Example 2 | 60.39 |
| Comparative Example 3 | 62.08 |
| Comparative Example 4 | 66.43 |
| Comparative Example 5 | 52.71 |
| Comparative Example 6 | 55.14 |
The optimized formulas showed tyrosinase inhibition rates around 78%, suggesting potential support for skin brightness-related applications.
4. Animal Study: Antioxidant Enzymes, Collagen Marker and Lipid Peroxidation
A D-galactose-induced skin aging mouse model was used to evaluate the oral liquid.
The main indicators included:
SOD enzyme activity;
GSH-Px enzyme activity;
hydroxyproline, or Hyp, as a collagen-related marker;
MDA, a lipid peroxidation marker.
Table 6. SOD, GSH-Px, Hyp and MDA Results in Mouse Skin Tissue
| Group | SOD, U/mg prot | GSH-Px, U/mg prot | Hyp, µg/mg | MDA, nmol/g |
|---|---|---|---|---|
| Blank group | 40.67 | 250.31 | 1.52 | 4.83 |
| Model group | 28.81 | 138.53 | 0.47 | 13.46 |
| Example 4 | 35.73 | 224.19 | 1.13 | 5.30 |
| Comparative Example 7 | 31.35 | 182.76 | 0.68 | 8.67 |
| Comparative Example 8 | 31.80 | 186.04 | 0.75 | 7.59 |
| Comparative Example 9 | 32.48 | 195.87 | 0.83 | 7.72 |
| Comparative Example 10 | 33.52 | 203.25 | 0.90 | 6.28 |
| Comparative Example 11 | 30.26 | 161.42 | 0.64 | 10.15 |
| Comparative Example 12 | 30.94 | 177.68 | 0.61 | 9.54 |
Compared with the model group, Example 4 showed higher SOD and GSH-Px activity, higher Hyp content and lower MDA level. This indicates better antioxidant protection and collagen-related support in the tested animal model.
5. Human Use Study: 28-Day Oral Beauty Product Evaluation
A human use study was conducted with 40 recruited volunteers. After exclusions, 38 valid subjects completed the evaluation.
The study used a single-center, single-blind, pre-and-post controlled design. The test group consumed the oral beauty liquid twice daily for 28 days. The control group consumed a non-functional control beverage.
Measurements were taken at:
D0: baseline;
D14: after 14 days;
D28: after 28 days.
Table 7. Volunteer Demographic and Screening Information
| ID | Gender | Age | Completed Study | Included in Statistics | Eye-Corner Wrinkle Grade at Screening | Group |
|---|---|---|---|---|---|---|
| RD0001 | Female | 34 | No | No | 2 | Test group |
| RD0002 | Male | 41 | Yes | Yes | 3 | Test group |
| RD0003 | Female | 54 | Yes | Yes | 3 | Test group |
| RD0004 | Female | 51 | Yes | Yes | 3 | Test group |
| RD0005 | Female | 46 | Yes | Yes | 2 | Test group |
| RD0006 | Female | 57 | Yes | Yes | 4 | Test group |
| RD0007 | Female | 45 | Yes | Yes | 3 | Test group |
| RD0008 | Male | 35 | Yes | Yes | 2 | Test group |
| RD0009 | Female | 49 | Yes | Yes | 2 | Test group |
| RD0010 | Female | 42 | Yes | Yes | 3 | Test group |
| RD0011 | Female | 42 | Yes | Yes | 4 | Test group |
| RD0012 | Female | 39 | Yes | Yes | 2 | Test group |
| RD0013 | Female | 44 | Yes | Yes | 2 | Test group |
| RD0014 | Female | 46 | Yes | Yes | 2 | Test group |
| RD0015 | Male | 34 | Yes | Yes | 1 | Test group |
| RD0016 | Female | 43 | Yes | Yes | 2 | Test group |
| RD0017 | Female | 37 | Yes | Yes | 1 | Test group |
| RD0018 | Male | 35 | Yes | Yes | 1 | Test group |
| RD0019 | Female | 34 | Yes | Yes | 1 | Test group |
| RD0020 | Female | 42 | Yes | Yes | 2 | Test group |
| RD0021 | Female | 44 | Yes | Yes | 2 | Control group |
| RD0022 | Female | 49 | Yes | Yes | 2 | Control group |
| RD0023 | Female | 36 | Yes | Yes | 1 | Control group |
| RD0024 | Female | 45 | Yes | Yes | 3 | Control group |
| RD0025 | Female | 45 | Yes | Yes | 2 | Control group |
| RD0026 | Female | 48 | Yes | Yes | 4 | Control group |
| RD0027 | Female | 42 | Yes | Yes | 2 | Control group |
| RD0028 | Female | 49 | Yes | Yes | 3 | Control group |
| RD0029 | Female | 33 | Yes | Yes | 1 | Control group |
| RD0030 | Female | 41 | Yes | Yes | 2 | Control group |
| RD0031 | Male | 40 | Yes | Yes | 1 | Control group |
| RD0032 | Female | 37 | Yes | Yes | 2 | Control group |
| RD0033 | Female | 45 | No | No | 3 | Control group |
| RD0034 | Female | 45 | Yes | Yes | 3 | Control group |
| RD0035 | Female | 43 | Yes | Yes | 2 | Control group |
| RD0036 | Female | 50 | Yes | Yes | 4 | Control group |
| RD0037 | Male | 50 | Yes | Yes | 4 | Control group |
| RD0038 | Female | 46 | Yes | Yes | 2 | Control group |
| RD0039 | Male | 44 | Yes | Yes | 3 | Control group |
| RD0040 | Female | 47 | Yes | Yes | 3 | Control group |
6. Instrumental Skin Test Results
Table 8. UC22 Epidermal Thickness Test Results
| Group | Time Point | n | Mean | SEM | Median | SD | Min | Max | Change Rate, % | p Value vs. Baseline |
|---|---|---|---|---|---|---|---|---|---|---|
| Test group | D0 | 19 | 113.21 | 1.28 | 109.00 | 5.57 | 109.00 | 125.00 | / | / |
| Test group | D14 | 19 | 125.84 | 2.77 | 125.00 | 12.09 | 109.00 | 156.00 | 11.16 | <0.001 |
| Test group | D28 | 19 | 122.47 | 1.80 | 125.00 | 7.86 | 109.00 | 140.00 | 8.18 | <0.001 |
| Control group | D0 | 19 | 114.58 | 1.61 | 117.00 | 7.00 | 101.00 | 125.00 | / | / |
| Control group | D14 | 19 | 118.79 | 1.91 | 117.00 | 8.30 | 101.00 | 140.00 | 3.67 | 0.1313 |
| Control group | D28 | 19 | 111.37 | 1.66 | 110.00 | 7.23 | 101.00 | 125.00 | -2.80 | 0.0445 |
Table 9. VISIA Skin Color b* Value Test Results
A lower b* value generally indicates reduced yellowish tone and improved skin brightness.
| Group | Time Point | n | Mean | SEM | Median | SD | Min | Max | Change Rate, % | p Value vs. Baseline |
|---|---|---|---|---|---|---|---|---|---|---|
| Test group | D0 | 19 | 26.21 | 0.66 | 25.67 | 2.87 | 21.11 | 33.56 | / | / |
| Test group | D14 | 19 | 25.58 | 0.72 | 25.73 | 3.14 | 20.55 | 32.95 | -2.40 | 0.0253 |
| Test group | D28 | 19 | 24.00 | 0.68 | 23.37 | 2.98 | 19.47 | 29.34 | -8.43 | <0.001 |
| Control group | D0 | 19 | 26.19 | 0.71 | 27.06 | 3.09 | 20.46 | 31.37 | / | / |
| Control group | D14 | 19 | 25.83 | 0.76 | 26.69 | 3.30 | 19.65 | 31.19 | -1.37 | 0.0257 |
| Control group | D28 | 19 | 25.04 | 0.70 | 25.12 | 3.05 | 19.87 | 30.62 | -4.39 | <0.001 |
Table 10. VISIA Eye-Corner Wrinkle Area Ratio Test Results
| Group | Time Point | n | Mean | SEM | Median | SD | Min | Max | Change Rate, % | p Value vs. Baseline |
|---|---|---|---|---|---|---|---|---|---|---|
| Test group | D0 | 19 | 4.42% | 0.30% | 4.00% | 1.32% | 2.84% | 7.82% | / | / |
| Test group | D14 | 19 | 4.17% | 0.27% | 3.93% | 1.16% | 2.44% | 7.91% | -5.66 | 0.0371 |
| Test group | D28 | 19 | 3.92% | 0.28% | 3.77% | 1.21% | 1.48% | 7.27% | -11.31 | 0.0020 |
| Control group | D0 | 19 | 4.23% | 0.16% | 3.94% | 0.68% | 3.12% | 5.25% | / | / |
| Control group | D14 | 19 | 4.18% | 0.21% | 4.04% | 0.91% | 2.81% | 6.19% | -1.18 | 0.7153 |
| Control group | D28 | 19 | 4.35% | 0.22% | 4.32% | 0.97% | 2.59% | 6.17% | 2.84 | 0.3243 |
Table 11. Stratum Corneum Moisture Content Test Results
| Group | Time Point | n | Mean | SEM | Median | SD | Min | Max | Change Rate, % | p Value vs. Baseline |
|---|---|---|---|---|---|---|---|---|---|---|
| Test group | D0 | 19 | 34.99 | 1.84 | 33.07 | 8.01 | 22.77 | 47.80 | / | / |
| Test group | D14 | 19 | 42.27 | 1.76 | 42.33 | 7.66 | 30.20 | 52.60 | 20.81 | <0.001 |
| Test group | D28 | 19 | 48.80 | 1.81 | 50.30 | 7.88 | 37.60 | 60.03 | 39.47 | <0.001 |
| Control group | D0 | 19 | 37.71 | 2.09 | 38.23 | 9.13 | 22.73 | 51.87 | / | / |
| Control group | D14 | 19 | 37.98 | 2.12 | 38.47 | 9.24 | 22.97 | 52.33 | 0.72 | <0.001 |
| Control group | D28 | 19 | 39.17 | 2.06 | 39.87 | 8.99 | 24.87 | 52.53 | 3.87 | <0.001 |
Table 12. Skin Elasticity R2 Test Results
| Group | Time Point | n | Mean | SEM | Median | SD | Min | Max | Change Rate, % | p Value vs. Baseline |
|---|---|---|---|---|---|---|---|---|---|---|
| Test group | D0 | 19 | 0.56 | 0.01 | 0.56 | 0.05 | 0.48 | 0.64 | / | / |
| Test group | D14 | 19 | 0.61 | 0.01 | 0.61 | 0.05 | 0.51 | 0.68 | 8.93 | <0.001 |
| Test group | D28 | 19 | 0.64 | 0.01 | 0.64 | 0.04 | 0.58 | 0.70 | 14.29 | <0.001 |
| Control group | D0 | 19 | 0.56 | 0.01 | 0.56 | 0.05 | 0.44 | 0.65 | / | / |
| Control group | D14 | 19 | 0.55 | 0.01 | 0.54 | 0.04 | 0.48 | 0.65 | -1.79 | 0.144 |
| Control group | D28 | 19 | 0.56 | 0.01 | 0.58 | 0.05 | 0.45 | 0.63 | 0.00 | 0.0503 |
Table 14. Skin Glycation Level, AGEs Test Results
| Group | Time Point | n | Mean | SEM | Median | SD | Min | Max | Change Rate, % | p Value vs. Baseline |
|---|---|---|---|---|---|---|---|---|---|---|
| Test group | D0 | 19 | 2.05 | 0.15 | 1.90 | 0.68 | 1.20 | 3.60 | / | / |
| Test group | D14 | 19 | 1.88 | 0.15 | 1.60 | 0.63 | 1.10 | 3.10 | -8.29 | 0.0019 |
| Test group | D28 | 19 | 1.72 | 0.14 | 1.60 | 0.62 | 1.00 | 2.90 | -16.10 | <0.001 |
| Control group | D0 | 19 | 2.02 | 0.10 | 1.80 | 0.45 | 1.30 | 2.80 | / | / |
| Control group | D14 | 19 | 2.12 | 0.11 | 2.00 | 0.47 | 1.60 | 3.00 | 4.95 | 0.0067 |
| Control group | D28 | 19 | 2.13 | 0.13 | 2.00 | 0.58 | 1.40 | 3.10 | 5.45 | 0.1713 |
After 28 days, the test group showed a larger reduction in measured skin AGEs than the control group. This supports the anti-glycation positioning of the formula.
7. Volunteer Self-Evaluation Results
Table 15. Volunteer Self-Evaluation Results at Day 14 and Day 28
Agreement rate refers to the percentage of volunteers giving a score of 4 or above.
| No. | Evaluation Indicator | Day 14 Test Group | Day 14 Control Group | Day 28 Test Group | Day 28 Control Group |
|---|---|---|---|---|---|
| 1 | Anti-wrinkle effect | 94.74% | 94.74% | 100.00% | 100.00% |
| 2 | Improvement in eye-corner wrinkles | 94.74% | 89.47% | 100.00% | 94.74% |
| 3 | Reduction of wrinkles and fine lines | 94.74% | 94.74% | 100.00% | 94.74% |
| 4 | Reduction of nasolabial folds | 100.00% | 89.47% | 94.74% | 94.74% |
| 5 | Improved skin elasticity | 100.00% | 100.00% | 100.00% | 100.00% |
| 6 | Improved skin firmness | 100.00% | 100.00% | 100.00% | 100.00% |
| 7 | Moisturizing effect | 100.00% | 94.74% | 100.00% | 94.74% |
| 8 | Improvement in skin roughness | 94.74% | 94.74% | 94.74% | 94.74% |
| 9 | Improved skin radiance after use | 100.00% | 100.00% | 100.00% | 100.00% |
| 10 | Skin-brightening effect | 100.00% | 100.00% | 100.00% | 94.74% |
| 11 | Improvement in dull skin tone | 100.00% | 100.00% | 100.00% | 94.74% |
| 12 | Overall skin condition improvement | 100.00% | 100.00% | 100.00% | 100.00% |
| 13 | Satisfaction with product aroma | 100.00% | 100.00% | 100.00% | 100.00% |
| 14 | Satisfaction with product taste | 100.00% | 100.00% | 100.00% | 100.00% |
Self-evaluation results were positive, especially for wrinkle improvement, moisturizing effect, skin brightness and taste satisfaction. For product developers, however, subjective feedback should always be used together with instrumental testing.
8. Safety Observation
Table 16. Adverse Reaction Follow-Up Results
| Option | Number of Subjects | Percentage, % |
|---|---|---|
| Irritating or adverse reactions occurred | 0 | 0.00 |
| No irritating or adverse reactions | 38 | 100.00 |
| Total | 38 | 100.00 |
No adverse reactions were reported during the study period.
9. Practical Takeaways for Herbal Oral Beauty Drink Development
For brands and factories developing natural beauty-from-within beverages, this formula provides several useful lessons.
9.1 Do Not Rely on One Single Ingredient
Collagen alone is not enough. A stronger oral beauty concept should combine:
collagen peptide nutrition;
antioxidant protection;
anti-glycation support;
skin barrier hydration;
herbal bioactives;
taste and stability technology.
9.2 Cistanche Can Be More Than a Traditional Tonic
Fermented Cistanche can be positioned as a modern botanical ingredient for oral beauty formulas. Its value lies in:
fermentation-enhanced bioavailability;
improved flavor profile;
polysaccharide and amino acid contribution;
compatibility with collagen and vitamin C systems.
9.3 Extraction Technology Directly Affects Efficacy
The comparative examples show that changing the extraction process can significantly reduce performance. For herbal factories, this means that selling "raw extract powder" is not enough. The real advantage is in:
extraction method;
fermentation design;
active compound preservation;
taste-masking technology;
stability control;
evidence-based formulation.
9.4 Sensory Design Is Critical
Herbal oral liquids often fail because of bitterness, grassy notes, sedimentation or instability. In this formula, hydroxypropyl-β-cyclodextrin, sweetener, citric acid, maltodextrin and xanthan gum help improve:
solubility;
mouthfeel;
suspension stability;
flavor balance;
consumer compliance.
9.5 Build a Data Chain Before Making Strong Claims
A strong oral beauty product should ideally be supported by:
in vitro mechanism data;
animal model data;
human use study data;
stability testing;
sensory evaluation;
safety observation;
regulatory review for target markets.
This is especially important for anti-glycation, anti-aging and skin-brightening claims.

Conclusion
A successful natural oral beauty drink should be designed as a complete system, not a simple mixture of collagen and herbal powder.
The Eucommia leaf, fermented Cistanche, Cornus officinalis and Gastrodia botanical complex described here showed strong performance in anti-glycation, antioxidant and tyrosinase-related assays. When formulated into an oral liquid with Type III collagen peptides, vitamin C, fructooligosaccharides and taste-stability excipients, the product showed promising results in animal testing and a 28-day human use study.
For Cistanche manufacturers, this offers a valuable direction: fermented Cistanche can become a functional hero ingredient in next-generation oral beauty products for skin health, hydration, elasticity and anti-glycation support.

High Active Ingredient: Cistanche Extract That Is Used In Functional Skincare Foods
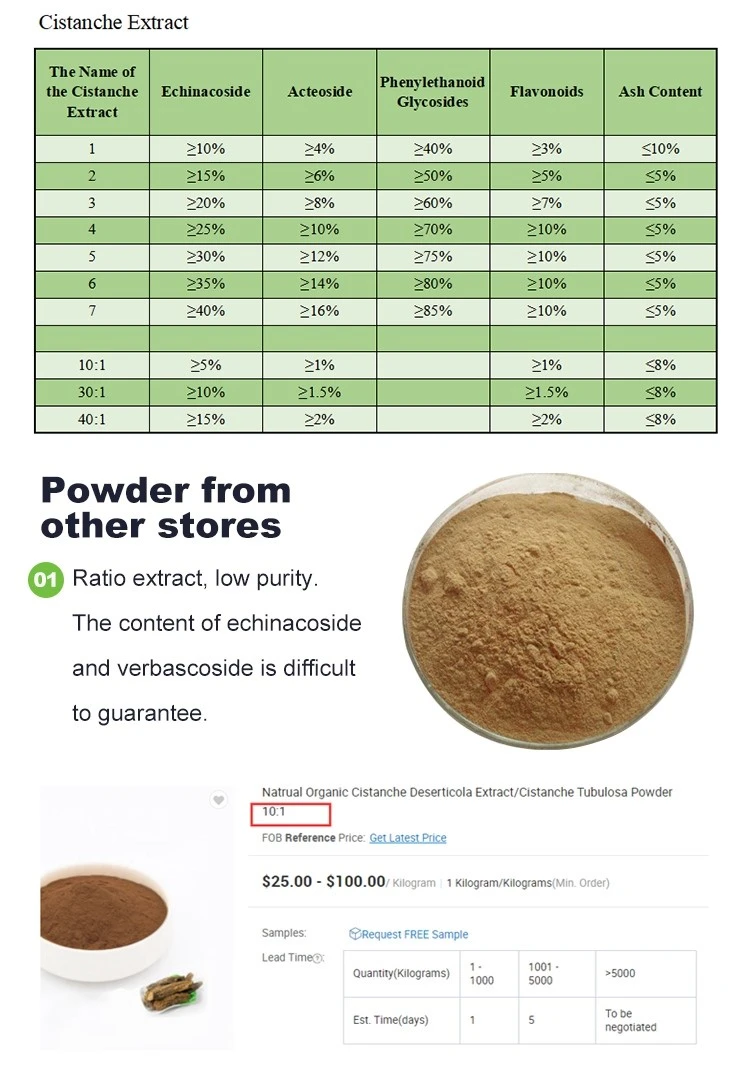
If you are developing a natural herbal oral beauty drink, Cistanche-based formulations may provide a strong foundation for both product differentiation and scientific storytelling.
Regulatory note:
The data above refer to a specific formula and specific test conditions. Finished-product claims should be validated with your own formulation and reviewed according to the regulations of your target market.