Quality Markers Of Cistanches Herba Based On Antioxidant Spectrum-Effect Relationship Ⅱ
Mar 19, 2024
3 results
3.1 Establishment of fingerprint map
Prepare 10 batches of test solutions according to the method under 2.1, use the chromatographic conditions under 2.2 for detection, obtain the fingerprints of each batch of samples (Figure 1), and select peak No. 11 (C11) as the reference peak of the fingerprint. Import the liquid phase data.AIA file of the fingerprint of the Cistanche deserticola test product into the "Traditional Chinese Medicine Chromatographic Fingerprint Similarity Evaluation System" software (2012 version). Seventeen common chromatographic peaks were calibrated in the common mode, and compared with the mixed reference standard spectrum (Figure 2), a total of 10 common peaks were identified.


3.2 Research on the antioxidant effect of Cistanche deserticola
3.2.1 Effect of Cistanche deserticola on the viability of HEK 293 cells.
Compared with cells in the normal group, Cistanche deserticola did not produce cytotoxicity at a mass concentration of 50~100 μg·mL–1, and the cell survival rates were greater than 90%. As the concentration of Cistanche deserticola increased, cell viability decreased. Therefore, Cistanche deserticola with a mass concentration of 100 µg·mL–1 was selected for subsequent administration.
3.2.2 Effect of Cistanche deserticola on ROS induced by H2O2 in HEK 293 cells
The ROS IC50 of Cistanche deserticola at different concentrations was calculated using GraphPad Prism 8 software. The results are shown in Figure 3 and Table 2.

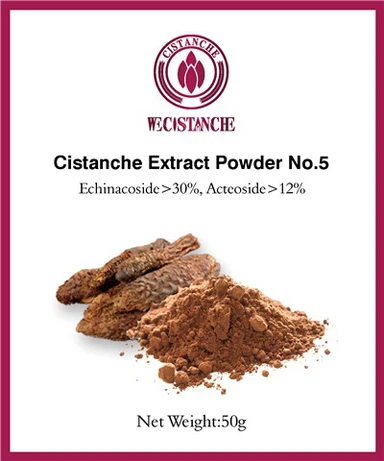
For more knowledge about cistanche, let's take a look at how to distinguish cistanche quality. Cistanche quality depends on the content of the active ingredients Echinacoside and Acteoside, the higher content means stronger function, today we take 30% Echinacoside and 12% Acteoside Cistanche Supplements as an example to give us an explanation, generally call cistanche in this article.
HOW LONG DOES IT TAKE FOR CISTANCHE TO WORK?
3.2.3 Effect of Cistanche deserticola on H2O2-induced SOD of HEK 293 cells
As shown in Figure 4, compared with the normal group, the SOD activity in the cells of the model group was significantly reduced, and the SOD activity of the Cistanche deserticola administration group increased to varying degrees (P<0.001), indicating that Cistanche deserticola can increase the intracellular SOD enzyme activity.

3.2.4 Effect of Cistanche deserticola on H2O2-induced CAT in HEK 293 cells
As shown in Figure 5, H2O2 can cause a significant decrease in intracellular CAT enzyme activity (P<0.001), with the activity only reaching 30% of the normal group, indicating that H2O2 has seriously damaged the antioxidant system of cells. After Cistanche deserticola administration, intracellular CAT enzyme activity decreased significantly (P<0.001). The enzyme activity was significantly increased (P<0.001).


3.3 Cistanche deserticola Q-marker screening based on spectral efficiency correlation analysis
3.3.1 PCA uses the eigenvalue > 1 and the cumulative variance contribution rate > 85% as the standard to extract 4 principal components. The scree plot (Figure 6) of the first three principal components has a steeper curve, which means that its contribution rate is higher. big. The cumulative variance contribution rate of the four principal components is 87.640%, indicating that these four principal components can represent 87.640% of the information of the original variables. The initial eigenvalues and variance contribution rates are shown in Table 3. The rotated component matrix is obtained by Kaiser normalization maximum variance method, see Table 4. According to the loading value of each chromatographic peak on the four principal components, the information reflected by each principal component can be extracted. That is, the larger the load value, the greater the influence of the chromatographic peak on the principal component. In principal component 1, peaks 1 to 3, 5, 7, 11, and 13 to 15 have the largest absolute loadings; in principal component 2, peaks 6 and 16 have the largest absolute loadings; peak 17 explains the information of principal component 3 , Peak 8 has the greatest impact on main component 4, so the 13 chemical components of peaks 1~3, 5~8, 11, 13~17 were selected as the main material basis of Cistanche deserticola for subsequent spectral efficiency analysis.
3.3.2 PCC
ROS IC50 is a negative indicator of drug efficacy, so a negative correlation coefficient means that the dependent variable is positively correlated with drug efficacy. The correlation coefficients of the 13 chromatographic peaks of Cistanche deserticola are all negative, indicating that they are all positively related to the removal of ROS IC50, among which peaks 14 and 3 , 7, 11, 1, and 13 were extremely strongly correlated with ROSIC50 (P<0.01), and peaks 2, 5, and 15 were strongly correlated (P<0.05); the 13 chromatographic peaks were all positively correlated with SOD, among which peaks 13 and 3 , 15, 11, 2 were extremely strongly correlated with SOD (P<0.01), and peaks 1, 14, 7, 5, and 6 were strongly correlated (P<0.05); 11 peaks were positively correlated with CAT, and peak 5 was positively correlated with CAT. There was a strong correlation (P<0.05). The results are shown in Table 5.
Combining the PCC results of ROS IC50, SOD, and CAT, peaks 1~3, 5, 7, 11, and 13~15 were selected as the active ingredient group for Cistanche deserticola to exert antioxidant effects.

3.3.3 PLS
In PLS, the ROS IC50 regression coefficients of 13 chromatographic peaks are all negative and positively correlated with the pharmacodynamic activity. Among them, the chromatographic peaks with VIP>1 are: 14, 3, 11, 1, 7, 13, 2, 5, 15 (Figure 7A); in the study of SOD enzyme activity, the coefficients of all peaks are positive, that is, all peaks are positively correlated with drug efficacy. Among them, the chromatographic peaks with VIP>1 are: 13, 3, 15, 11, 2, 1 , 14, 7 (Figure 7B); in the study of CAT enzyme activity, except for peaks 6 and 16, the other chromatographic peaks are positively correlated with drug efficacy, among which the chromatographic peaks with VIP>1 are: 5, 13, 14, 11 , 7 (Fig. 7C). The compounds represented by peaks 1~3, 5, 7, 11, and 13~15 were screened out as potential antioxidant active components in the PLS model.
3.4 Cistanche deserticola Q-marker activity verification
3.4.1 Effect of active ingredients on HEK 293 cytotoxicity
Based on the results of spectrum-effect correlation analysis, 6 ingredients including genipinic acid, 8-epistrychnoic acid, echinaceoside, verbascoside, anthocynoside A, and isorbascoside were selected for activity verification. The six active ingredients of Cistanche deserticola showed no cytotoxicity at concentrations ranging from 0.781 to 3.125 µmol·mL–1, and the cell survival rates were all greater than 90%. As the concentration increases, cell viability is inhibited. Therefore, the subsequent dosing concentrations were selected as 0.781, 1.563, and 3.125 µmol·mL–1.

3.4.2 Active ingredient pairs
The antioxidant effect of H2O2-induced HEK 293 cells was verified by detecting the scavenging effect of each active ingredient on intracellular ROS and the ability to regulate the activity of SOD and CAT enzymes to verify whether it has an antioxidant effect. In the ROS scavenging experiment, the differences between the mid- and high-dose genipinic acid groups and the model group were statistically significant (P<0.01, P<0.001, Figure 8A). Compared with the model group, there were statistically significant differences between the low, medium and high dose groups of inulin, anthoside A, verbascoside and isorbascoside (P<0.001, Figure 8B, Figure 8C), indicating that the six monomers All have a certain degree of ROS scavenging effect; in the SOD and CAT enzyme activity measurement test, the enzyme activities of the low, medium and high dose groups of active ingredients were all higher than the model group, indicating that all 6 monomers can increase SOD and CAT Enzyme activity.